Main article: 2000 United States presidential election
The 2000 United States presidential election in South Dakota took place on November 7, 2000, and was part of the 2000 United States presidential election . Voters chose three representatives, or electors to the Electoral College , who voted for president and vice president .
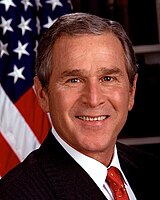
South Dakota was won by Governor George W. Bush by a 22.74 point margin of victory.
Results
Results by county
County
George W. Bush
Al Gore
Pat Buchanan
Howard Phillips
Harry E. Browne
Margin
Total votes cast
#
%
#
%
#
%
#
%
#
%
#
%
Aurora
847
59.94%
513
36.31%
32
2.26%
15
1.06%
6
0.42%
334
23.63%
1,413
Beadle
4,347
56.17%
3,216
41.56%
81
1.05%
45
0.58%
50
0.65%
1,131
14.61%
7,739
Bennett
712
63.80%
377
33.78%
9
0.81%
9
0.81%
9
0.81%
335
30.02%
1,116
Bon Homme
1,901
60.56%
1,162
37.02%
40
1.27%
17
0.54%
19
0.61%
739
23.54%
3,139
Brookings
6,212
56.55%
4,546
41.39%
87
0.79%
49
0.45%
90
0.82%
1,666
15.16%
10,984
Brown
9,060
54.72%
7,173
43.33%
158
0.95%
92
0.56%
73
0.44%
1,887
11.39%
16,556
Brule
1,268
58.51%
818
37.75%
39
1.80%
27
1.25%
15
0.69%
450
20.76%
2,167
Buffalo
140
34.31%
256
62.75%
9
2.21%
3
0.74%
0
0.00%
-116
-28.44%
408
Butte
2,760
74.82%
840
22.77%
41
1.11%
21
0.57%
27
0.73%
1,920
52.05%
3,689
Campbell
739
80.59%
147
16.03%
22
2.40%
8
0.87%
1
0.11%
592
64.56%
917
Charles Mix
2,205
61.61%
1,300
36.32%
46
1.29%
15
0.42%
13
0.36%
905
25.29%
3,579
Clark
1,272
60.34%
791
37.52%
31
1.47%
10
0.47%
4
0.19%
481
22.82%
2,108
Clay
2,363
46.29%
2,638
51.67%
31
0.61%
21
0.41%
52
1.02%
-275
-5.38%
5,105
Codington
6,718
60.32%
4,192
37.64%
127
1.14%
59
0.53%
42
0.38%
2,526
22.68%
11,138
Corson
629
50.60%
549
44.17%
50
4.02%
8
0.64%
7
0.56%
80
6.43%
1,243
Custer
2,495
69.83%
955
26.73%
45
1.26%
38
1.06%
40
1.12%
1,540
43.10%
3,573
Davison
4,445
59.05%
2,936
39.00%
62
0.82%
60
0.80%
25
0.33%
1,509
20.05%
7,528
Day
1,623
50.77%
1,492
46.67%
49
1.53%
21
0.66%
12
0.38%
131
4.10%
3,197
Deuel
1,245
55.98%
926
41.64%
38
1.71%
8
0.36%
7
0.31%
319
14.34%
2,224
Dewey
761
45.27%
880
52.35%
20
1.19%
16
0.95%
4
0.24%
-119
-7.08%
1,681
Douglas
1,311
76.71%
363
21.24%
19
1.11%
10
0.59%
6
0.35%
948
55.47%
1,709
Edmunds
1,257
63.29%
676
34.04%
28
1.41%
18
0.91%
7
0.35%
581
29.25%
1,986
Fall River
2,185
63.72%
1,133
33.04%
46
1.34%
30
0.87%
35
1.02%
1,052
30.68%
3,429
Faulk
904
68.02%
388
29.19%
25
1.88%
9
0.68%
3
0.23%
516
38.83%
1,329
Grant
2,235
58.36%
1,475
38.51%
77
2.01%
29
0.76%
14
0.37%
760
19.85%
3,830
Gregory
1,487
65.88%
718
31.81%
35
1.55%
11
0.49%
6
0.27%
769
34.07%
2,257
Haakon
938
83.08%
164
14.53%
21
1.86%
5
0.44%
1
0.09%
774
68.55%
1,129
Hamlin
1,731
63.57%
923
33.90%
38
1.40%
14
0.51%
17
0.62%
808
29.67%
2,723
Hand
1,419
69.87%
565
27.82%
28
1.38%
13
0.64%
6
0.30%
854
42.05%
2,031
Hanson
944
66.43%
457
32.16%
6
0.42%
10
0.70%
4
0.28%
487
34.27%
1,421
Harding
650
88.92%
64
8.76%
10
1.37%
4
0.55%
3
0.41%
586
80.16%
731
Hughes
5,188
68.86%
2,212
29.36%
54
0.72%
44
0.58%
36
0.48%
2,976
39.50%
7,534
Hutchinson
2,497
68.88%
1,052
29.02%
51
1.41%
19
0.52%
6
0.17%
1,445
39.86%
3,625
Hyde
592
70.90%
218
26.11%
20
2.40%
3
0.36%
2
0.24%
374
44.79%
835
Jackson
687
66.06%
319
30.67%
16
1.54%
11
1.06%
7
0.67%
368
35.39%
1,040
Jerauld
624
55.61%
468
41.71%
19
1.69%
7
0.62%
4
0.36%
156
13.90%
1,122
Jones
509
76.66%
137
20.63%
5
0.75%
9
1.36%
4
0.60%
372
56.03%
664
Kingsbury
1,612
59.11%
1,049
38.47%
36
1.32%
12
0.44%
18
0.66%
563
20.64%
2,727
Lake
2,724
52.85%
2,331
45.23%
47
0.91%
27
0.52%
25
0.49%
393
7.62%
5,154
Lawrence
6,327
67.27%
2,797
29.74%
110
1.17%
73
0.78%
99
1.05%
3,530
37.53%
9,406
Lincoln
6,546
62.01%
3,844
36.42%
80
0.76%
56
0.53%
30
0.28%
2,702
25.59%
10,556
Lyman
875
63.13%
482
34.78%
14
1.01%
11
0.79%
4
0.29%
393
28.35%
1,386
Marshall
1,097
52.77%
939
45.17%
19
0.91%
15
0.72%
9
0.43%
158
7.60%
2,079
McCook
1,610
61.19%
965
36.68%
43
1.63%
12
0.46%
1
0.04%
645
24.51%
2,631
McPherson
1,073
75.72%
295
20.82%
33
2.33%
15
1.06%
1
0.07%
778
54.90%
1,417
Meade
6,870
73.35%
2,267
24.20%
102
1.09%
65
0.69%
62
0.66%
4,603
49.15%
9,366
Mellette
495
67.53%
222
30.29%
12
1.64%
2
0.27%
2
0.27%
273
37.24%
733
Miner
724
57.19%
523
41.31%
11
0.87%
6
0.47%
2
0.16%
201
15.88%
1,266
Minnehaha
33,428
54.47%
27,042
44.06%
381
0.62%
228
0.37%
290
0.47%
6,386
10.41%
61,369
Moody
1,361
49.76%
1,318
48.19%
28
1.02%
14
0.51%
14
0.51%
43
1.57%
2,735
Pennington
24,696
67.55%
11,123
30.43%
275
0.75%
195
0.53%
268
0.73%
13,573
37.12%
36,557
Perkins
1,237
76.64%
297
18.40%
49
3.04%
20
1.24%
11
0.68%
940
58.24%
1,614
Potter
1,112
74.43%
356
23.83%
13
0.87%
7
0.47%
6
0.40%
756
50.60%
1,494
Roberts
2,237
54.91%
1,700
41.73%
93
2.28%
26
0.64%
18
0.44%
537
13.18%
4,074
Sanborn
767
60.49%
468
36.91%
15
1.18%
9
0.71%
9
0.71%
299
23.58%
1,268
Shannon
252
12.90%
1,667
85.36%
14
0.72%
10
0.51%
10
0.51%
-1,415
-72.46%
1,953
Spink
1,957
59.59%
1,274
38.79%
26
0.79%
18
0.55%
9
0.27%
683
20.80%
3,284
Stanley
955
69.15%
402
29.11%
13
0.94%
7
0.51%
4
0.29%
553
40.04%
1,381
Sully
633
72.68%
209
24.00%
20
2.30%
6
0.69%
3
0.34%
424
48.68%
871
Todd
478
31.99%
993
66.47%
7
0.47%
10
0.67%
6
0.40%
-515
-34.48%
1,494
Tripp
1,909
69.04%
799
28.90%
36
1.30%
13
0.47%
8
0.29%
1,110
40.14%
2,765
Turner
2,514
62.79%
1,414
35.31%
39
0.97%
25
0.62%
12
0.30%
1,100
27.48%
4,004
Union
3,265
56.57%
2,358
40.85%
109
1.89%
23
0.40%
17
0.29%
907
15.72%
5,772
Walworth
1,758
68.86%
721
28.24%
41
1.61%
21
0.82%
12
0.47%
1,037
40.62%
2,553
Yankton
4,904
56.11%
3,596
41.14%
131
1.50%
68
0.78%
41
0.47%
1,308
14.97%
8,740
Ziebach
384
53.26%
314
43.55%
10
1.39%
7
0.97%
6
0.83%
70
9.71%
721
Totals
190,700
60.30%
118,804
37.56%
3,322
1.05%
1,781
0.56%
1,662
0.53%
71,896
22.74%
316,269
Counties that flipped from Democratic to Republican
By congressional district
Due to the state's low population, only one congressional district is allocated. This district is called the at-large district, because it covers the entire state, and thus is equivalent to the statewide election results.
Electors
Main article: List of 2000 United States presidential electors
The electors of each state and the District of Columbia met on December 18, 2000 to cast their votes for president and vice president. The Electoral College itself never meets as one body. Instead the electors from each state and the District of Columbia met in their respective capitols.
The following were the members of the Electoral College from the state. All were pledged to and voted for George Bush and Dick Cheney:
Carole Hillard William J. Janklow Joel Rosenthal See also
References
"Dave Leip's Atlas of U.S. Presidential Elections" .SD US Presidential Election Race, November 07, 2000
2000 Presidential General Election Results - Pennsylvania
"President Elect - 2000" . Archived from the original on February 12, 2012. Retrieved May 10, 2011.
Categories :
Text is available under the Creative Commons Attribution-ShareAlike License. Additional terms may apply.
**DISCLAIMER** We are not affiliated with Wikipedia, and Cloudflare.
The information presented on this site is for general informational purposes only and does not constitute medical advice.
You should always have a personal consultation with a healthcare professional before making changes to your diet, medication, or exercise routine.
AI helps with the correspondence in our chat.
We participate in an affiliate program. If you buy something through a link, we may earn a commission 💕
↑
 County Results


