Main article: 2000 United States presidential election
| ||||||||||||||||||||||||||
| ||||||||||||||||||||||||||
 County Results County Results
| ||||||||||||||||||||||||||
| ||||||||||||||||||||||||||
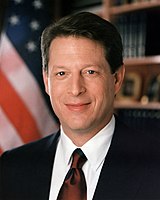
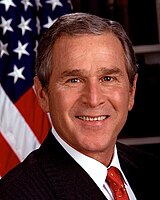
The 2000 United States presidential election in New Mexico took place on November 7, 2000, and was part of the 2000 United States presidential election. Voters chose five electors to the Electoral College, who voted for president and vice president. New Mexico was won by Vice President Al Gore by a 0.06 percent margin. It was the closest state in the entire presidential election by raw vote margin (366 votes), which was even closer than Florida. News outlets called New Mexico for Gore at approximately 10:21 p.m. (EST), but later retracted the call when it was determined to be too close to call.
Gore was not declared the winner of the state until November 17. This would be the first election in which New Mexico failed to vote for the winning candidate since 1976 and the first time since its statehood in 1912 that it voted for a different candidate than Nevada. Although New Mexico did vote for the popular vote winner in this election. As of 2020, this is the last time that New Mexico voted more Republican than the nation as a whole. Bush became the first Republican to win the White House without carrying the state of New Mexico since its statehood, as well as the first to win without Bernalillo County.
In the days following the election, when the disputes and recounts began, New Mexico, despite having a razor-thin margin, went largely ignored. Its five electoral votes alone would not have changed the overall outcome in the Electoral College if it were switched from Gore to Bush. The respective campaigns ended up paying little attention to recount efforts in New Mexico, and focused their efforts solely on Florida. Likewise, the media focused very little on the New Mexico recount. After the final count was certified for Gore on November 30, the Bush campaign did not challenge the results.
Results
| Party | Candidate | Votes | % | ±% | |
|---|---|---|---|---|---|
| Democratic | 286,783 | 47.91% | −1.27 | ||
| Republican | 286,417 | 47.85% | +5.99 | ||
| Green | 21,251 | 3.55% | +1.17 | ||
| Libertarian | 2,058 | 0.34% | −0.20 | ||
| Reform | 1,392 | 0.23% | −5.57 | ||
| Natural Law | 361 | 0.06% | −0.06 | ||
| Constitution |
|
343 | 0.06% | −0.07 | |
| Total votes | 598,605 | 100.00% | |||
| Democratic win | |||||
Results by county
| County | Al Gore Democratic |
George W. Bush Republican |
Ralph Nader Pacific Green |
Various candidates Other parties |
Margin | Total votes cast | |||||
|---|---|---|---|---|---|---|---|---|---|---|---|
| # | % | # | % | # | % | # | % | # | % | ||
| Bernalillo | 99,461 | 48.68% | 95,249 | 46.62% | 8,274 | 4.05% | 1,335 | 0.65% | 4,212 | 2.06% | 204,319 |
| Catron | 353 | 20.63% | 1,273 | 74.40% | 57 | 3.33% | 28 | 1.64% | -920 | -53.77% | 1,711 |
| Chaves | 6,340 | 34.93% | 11,378 | 62.69% | 307 | 1.69% | 124 | 0.68% | -5,038 | -27.76% | 18,149 |
| Cibola | 4,127 | 58.23% | 2,752 | 38.83% | 164 | 2.31% | 45 | 0.64% | 1,375 | 19.40% | 7,088 |
| Colfax | 2,653 | 48.58% | 2,600 | 47.61% | 163 | 2.98% | 1,335 | 0.65% | 53 | 0.97% | 5,461 |
| Curry | 3,471 | 29.00% | 8,301 | 69.35% | 147 | 1.23% | 50 | 0.42% | -4,830 | -40.35% | 11,969 |
| De Baca | 349 | 35.54% | 612 | 62.32% | 12 | 1.22% | 9 | 0.91% | -263 | -26.78% | 982 |
| Doña Ana | 23,912 | 51.26% | 21,263 | 45.58% | 1,158 | 2.48% | 320 | 0.69% | 2,649 | 5.68% | 46,653 |
| Eddy | 7,108 | 39.96% | 10,335 | 58.10% | 256 | 1.44% | 88 | 0.49% | -3,227 | -18.14% | 17,787 |
| Grant | 5,673 | 50.47% | 4,961 | 44.13% | 530 | 4.71% | 77 | 0.68% | 712 | 6.34% | 11,241 |
| Guadalupe | 1,076 | 65.17% | 548 | 33.19% | 24 | 1.45% | 3 | 0.18% | 528 | 31.98% | 1,651 |
| Harding | 214 | 36.09% | 366 | 61.72% | 9 | 1.52% | 4 | 0.67% | -152 | -25.63% | 593 |
| Hidalgo | 839 | 45.75% | 954 | 52.02% | 28 | 1.53% | 13 | 0.71% | -115 | -6.27% | 1,834 |
| Lea | 3,855 | 27.04% | 10,157 | 71.25% | 169 | 1.19% | 75 | 0.53% | -6,302 | -44.21% | 14,256 |
| Lincoln | 2,027 | 29.93% | 4,458 | 65.83% | 168 | 2.48% | 119 | 1.76% | -2,431 | -35.90% | 6,772 |
| Los Alamos | 4,149 | 40.60% | 5,623 | 55.03% | 329 | 3.22% | 117 | 1.15% | -1,474 | -14.43% | 10,218 |
| Luna | 2,975 | 44.99% | 3,395 | 51.35% | 186 | 2.81% | 56 | 0.85% | -420 | -6.34% | 6,612 |
| McKinley | 10,281 | 64.75% | 5,070 | 31.93% | 392 | 2.47% | 136 | 0.86% | 5,211 | 32.82% | 15,879 |
| Mora | 1,456 | 66.45% | 668 | 30.49% | 49 | 2.24% | 18 | 0.82% | 788 | 35.96% | 2,191 |
| Otero | 5,465 | 33.73% | 10,258 | 63.31% | 338 | 2.09% | 143 | 0.88% | -4,793 | -29.58% | 16,204 |
| Quay | 1,471 | 38.27% | 2,292 | 59.63% | 51 | 1.33% | 30 | 0.78% | -821 | -21.36% | 3,844 |
| Rio Arriba | 8,169 | 67.53% | 3,495 | 28.89% | 377 | 3.12% | 56 | 0.46% | 4,674 | 38.64% | 12,097 |
| Roosevelt | 1,762 | 31.18% | 3,762 | 66.57% | 98 | 1.73% | 29 | 0.51% | -2,000 | -35.39% | 5,651 |
| San Juan | 11,980 | 34.57% | 21,434 | 61.85% | 923 | 2.66% | 320 | 0.92% | -9,454 | -27.28% | 34,657 |
| San Miguel | 6,540 | 71.39% | 2,215 | 24.18% | 344 | 3.76% | 62 | 0.68% | 4,325 | 47.21% | 9,161 |
| Sandoval | 14,899 | 46.92% | 15,423 | 48.57% | 1,211 | 3.81% | 222 | 0.70% | -524 | -1.65% | 31,755 |
| Santa Fe | 32,017 | 64.72% | 13,974 | 28.25% | 3,215 | 6.50% | 265 | 0.54% | 18,043 | 36.47% | 49,471 |
| Sierra | 1,689 | 36.83% | 2,721 | 59.33% | 132 | 2.88% | 44 | 0.96% | -1,032 | -22.50% | 4,586 |
| Socorro | 3,294 | 48.26% | 3,173 | 46.48% | 279 | 4.09% | 80 | 1.17% | 121 | 1.78% | 6,826 |
| Taos | 7,039 | 64.61% | 2,744 | 25.19% | 1,064 | 9.77% | 48 | 0.44% | 4,295 | 39.42% | 10,895 |
| Torrance | 1,868 | 37.66% | 2,891 | 58.29% | 163 | 3.29% | 38 | 0.77% | -1,023 | -20.63% | 4,960 |
| Union | 452 | 25.75% | 1,269 | 72.31% | 19 | 1.08% | 15 | 0.85% | -817 | -46.56% | 1,755 |
| Valencia | 9,819 | 45.93% | 10,803 | 50.54% | 615 | 2.88% | 140 | 0.65% | -984 | -4.61% | 21,377 |
| Totals | 286,783 | 47.91% | 286,417 | 47.85% | 21,251 | 3.55% | 4,154 | 0.69% | 366 | 0.06% | 598,605 |
Counties that flipped from Democratic to Republican
- De Baca (Largest village: Fort Sumner)
- Eddy (Largest city: Carlsbad)
- Hidalgo (Largest city: Lordsburg)
- Luna (Largest city: Deming)
- Sandoval (Largest city: Bernalillo)
- Sierra (Largest city: Truth or Consequences)
- Valencia (Largest city: Los Lunas)
Results by congressional district
Gore won 2 of 3 congressional districts, including one held by a Republican.
| District | Bush | Gore | Representative |
|---|---|---|---|
| 1st | 47.8% | 47.9% | Heather Wilson |
| 2nd | 54% | 43% | Joe Skeen |
| 3rd | 40% | 57% | Tom Udall |
Electors
Main article: List of 2000 United States presidential electorsTechnically the voters of New Mexico cast their ballots for electors: representatives to the Electoral College. New Mexico is allocated 5 electors because it has 3 congressional districts and 2 senators. All candidates who appear on the ballot or qualify to receive write-in votes must submit a list of 5 electors, who pledge to vote for their candidate and his or her running mate. Whoever wins the most votes in the state is awarded all 5 electoral votes. Their chosen electors then vote for president and vice president. Although electors are pledged to their candidate and running mate, they are not obligated to vote for them. An elector who votes for someone other than his or her candidate is known as a faithless elector.
The electors of each state and the District of Columbia met on December 18, 2000 to cast their votes for president and vice president. The Electoral College itself never meets as one body. Instead the electors from each state and the District of Columbia met in their respective capitols.
The following were the members of the Electoral College from the state. All were pledged to and voted for Gore and Lieberman:
- Tom Atcitty
- Rick Blea
- Diane D. Denish
- Jeep Gilliland
- Mary Gail Gwaltney
References
- "2000 Events Timeline - Election Night". Dave Leip's Atlas of U.S. Presidential Elections. Retrieved January 11, 2012.
- "2000 Events Timeline - Post-Election". Dave Leip's Atlas of U.S. Presidential Elections. Retrieved January 11, 2012.
- Ferguson, Chaka (November 18, 2000). "Gore Finally Wins in New Mexico". AP. Yahoo.com. Retrieved January 11, 2012.
- "Presidential Results by Congressional District, 2000-2008". Archived from the original on September 24, 2015. Retrieved January 11, 2012.
- "2000 Presidential General Election Results - New Mexico". Dave Leip's Atlas of U.S. Presidential Elections. Retrieved January 11, 2012.
- "Recounts might spread to New Mexico, Oregon". USA Today. November 13, 2000. Archived from the original on August 8, 2012. Retrieved January 11, 2012.
- ^ "Bush decides against recount in New Mexico". CNN. December 9, 2000. Archived from the original on October 28, 2014. Retrieved January 11, 2012.
- 2000 Presidential General Election Results - New Mexico US Election Atlas
- "2000 Post-Election Timeline of Events".
- "President Elect - 2000". Archived from the original on February 12, 2012. Retrieved November 1, 2009.
| State and district results of the 2000 United States presidential election | ||
|---|---|---|
|  | |
| (1999 ←) 2000 United States elections (→ 2001) | |
|---|---|
| President | |
| U.S. Senate |
|
| U.S. House |
|
| State governors | |
| Attorneys General | |
| State legislature |
|
| Mayors | |


