| |||||||||||||||||||||||||||||||||||||
14 of the 42 seats to Basildon District Council 22 seats needed for a majority | |||||||||||||||||||||||||||||||||||||
|---|---|---|---|---|---|---|---|---|---|---|---|---|---|---|---|---|---|---|---|---|---|---|---|---|---|---|---|---|---|---|---|---|---|---|---|---|---|
| |||||||||||||||||||||||||||||||||||||
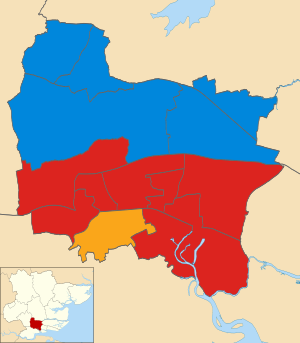
 Map showing the results of contested wards in the 1999 Basildon Borough Council elections. Map showing the results of contested wards in the 1999 Basildon Borough Council elections. | |||||||||||||||||||||||||||||||||||||
| |||||||||||||||||||||||||||||||||||||
The 1999 Basildon District Council election took place on 6 May 1999 to elect members of Basildon District Council in Essex, England. One third of the council was up for election and the Labour party stayed in overall control of the council.
After the election, the composition of the council was
- Labour 23
- Conservative 11
- Liberal Democrats 8
Election result
The results saw Labour keep their majority after retaining all the seats they had been defending in Basildon. The Conservatives became the main opposition on the council after gaining seats from the Liberal Democrats in Billericay and Wickford. Overall turnout in the election was 24.3%.
| Party | Seats | Gains | Losses | Net gain/loss | Seats % | Votes % | Votes | +/− | |
|---|---|---|---|---|---|---|---|---|---|
| Labour | 8 | 0 | 0 | 57.1 | 40.0 | 12,173 | |||
| Conservative | 5 | 5 | 0 | 35.7 | 37.4 | 11,401 | |||
| Liberal Democrats | 1 | 0 | 5 | 7.1 | 17.8 | 5,408 | |||
| Residents | 0 | 0 | 0 | 0.0 | 4.2 | 1,287 | New | ||
| Independent | 0 | 0 | 0 | 0.0 | 0.6 | 184 | New | ||
All comparisons in vote share are to the corresponding 1995 election.
Ward results
Billericay East

| Party | Candidate | Votes | % | |
|---|---|---|---|---|
| Conservative | Tony Archer | 1,102 | 52.3% | |
| Liberal Democrats | F. Bellard | 701 | 33.3% | |
| Labour | P. Reid | 304 | 14.4% | |
| Turnout | 23.9% | |||
| Conservative gain from Liberal Democrats | ||||
Billericay West

| Party | Candidate | Votes | % | |
|---|---|---|---|---|
| Conservative | Stephen Horgan | 1,364 | 47.0% | |
| Residents | Taylor G. | 1,287 | 44.3% | |
| Labour | L. Howard | 253 | 8.7% | |
| Turnout | 27.5% | |||
| Conservative gain from Liberal Democrats | ||||
Burstead

| Party | Candidate | Votes | % | |
|---|---|---|---|---|
| Conservative | Desmond Lake | 1,196 | 55.2% | |
| Liberal Democrats | C. Hands | 608 | 28.0% | |
| Labour | M. Viney | 364 | 16.8% | |
| Turnout | 24.8% | |||
| Conservative gain from Liberal Democrats | ||||
Fryerns Central

| Party | Candidate | Votes | % | |
|---|---|---|---|---|
| Labour | Annie Humphries | 1,293 | 68.8% | |
| Conservative | W. Marck | 350 | 18.6% | |
| Liberal Democrats | S. Dickinson | 193 | 10.3% | |
| Independent | A. Viccary | 42 | 2.2% | |
| Turnout | 23.6% | |||
| Labour hold | ||||
Fryerns East

| Party | Candidate | Votes | % | |
|---|---|---|---|---|
| Labour | L. Rossati | 1,107 | 70.3% | |
| Conservative | D. Allen | 331 | 21.0% | |
| Liberal Democrats | J. Lutton | 137 | 8.7% | |
| Turnout | 20.9% | |||
| Labour hold | ||||
Laindon

| Party | Candidate | Votes | % | |
|---|---|---|---|---|
| Labour | Tony Bennett | 1,081 | 49.1% | |
| Conservative | D. Walsh | 769 | 34.9% | |
| Liberal Democrats | V. Howard | 209 | 9.5% | |
| Independent | S. Chaney | 142 | 6.5% | |
| Turnout | 22.4% | |||
| Labour hold | ||||
Langdon Hills

| Party | Candidate | Votes | % | |
|---|---|---|---|---|
| Labour | Bob Sears | 1,329 | 49.5% | |
| Conservative | S. Hillier | 1,177 | 43.9% | |
| Liberal Democrats | M. Dickinson | 177 | 6.6% | |
| Turnout | 27.8% | |||
| Labour hold | ||||
Lee Chapel

| Party | Candidate | Votes | % | |
|---|---|---|---|---|
| Labour | Lynda Gordon | 1,202 | 64.4% | |
| Conservative | S. Popplewell | 456 | 24.4% | |
| Liberal Democrats | M. Dale | 208 | 11.1% | |
| Turnout | 25.0% | |||
| Labour hold | ||||
Nethermayne

| Party | Candidate | Votes | % | |
|---|---|---|---|---|
| Liberal Democrats | Joe White | 1,128 | 47.9% | |
| Labour | A. Manning | 794 | 33.7% | |
| Conservative | S. Allen | 434 | 18.4% | |
| Turnout | 34.4% | |||
| Liberal Democrats hold | ||||
Pitsea East

| Party | Candidate | Votes | % | |
|---|---|---|---|---|
| Labour | Keith Bobbin | 1,235 | 50.9% | |
| Conservative | K. Blake | 990 | 40.8% | |
| Liberal Democrats | J. Baker | 201 | 8.3% | |
| Turnout | 23.2% | |||
| Labour hold | ||||
Pitsea West

| Party | Candidate | Votes | % | |
|---|---|---|---|---|
| Labour | David Abrahall | 1,122 | 69.0% | |
| Conservative | A. Hedley | 347 | 21.4% | |
| Liberal Democrats | L. Bellard | 156 | 9.6% | |
| Turnout | 19.9% | |||
| Labour hold | ||||
Vange

| Party | Candidate | Votes | % | |
|---|---|---|---|---|
| Labour | D. Golding | 893 | 65.3% | |
| Conservative | R. Cornish | 370 | 27.1% | |
| Liberal Democrats | L. Williams | 104 | 7.6% | |
| Turnout | 17.4% | |||
| Labour hold | ||||
Wickford North

| Party | Candidate | Votes | % | |
|---|---|---|---|---|
| Conservative | Michael Mowe | 1,094 | 43.7% | |
| Liberal Democrats | A. Banton | 878 | 35.1% | |
| Labour | C. Wilson | 532 | 21.2% | |
| Turnout | 27.1% | |||
| Conservative gain from Liberal Democrats | ||||
Wickford South

| Party | Candidate | Votes | % | |
|---|---|---|---|---|
| Conservative | Don Morris | 1,421 | 50.9% | |
| Liberal Democrats | S. Howe | 708 | 25.3% | |
| Labour | A. Ede | 664 | 23.8% | |
| Turnout | 23.6% | |||
| Conservative gain from Liberal Democrats | ||||
References
- "Council compositions by year". The Elections Centre.
- "Local Election Summaries 1999". The Elections Centre.
- "Basildon". BBC News Online. Retrieved 25 June 2011.
- ^ "How the nations voted". The Times. 8 May 1999. p. 48.
- "Elections: Tories seize Wickford and Billericay". Southend Standard. 10 May 1999. Retrieved 25 June 2011.
- "Elections: Southend makes Tories blue". Southend Standard. 10 May 1999. Retrieved 25 June 2011.
- "Local Election Results, 1999". Centre for Research into Elections and Social Trends. Archived from the original on 24 July 2011. Retrieved 25 June 2011.
- ^ "Basildon District Council Election Results 1973–2012" (PDF). Elections Centre. Retrieved 3 August 2019.
- "Billericay East". Basildon District Council. Archived from the original on 25 May 2001. Retrieved 12 October 2019.
- "Billericay West". Basildon District Council. Archived from the original on 18 November 2001. Retrieved 12 October 2019.
- "Burstead". Basildon District Council. Archived from the original on 7 July 2001. Retrieved 12 October 2019.
- "Fryerns Central". Basildon District Council. Archived from the original on 24 February 2002. Retrieved 12 October 2019.
- "Laindon". Basildon District Council. Archived from the original on 25 May 2001. Retrieved 12 October 2019.
- "Langdon Hills". Basildon District Council. Archived from the original on 25 May 2001. Retrieved 12 October 2019.
- "Billericay West". Basildon District Council. Archived from the original on 25 May 2001. Retrieved 12 October 2019.
- "Nethermayne". Basildon District Council. Archived from the original on 25 May 2001. Retrieved 12 October 2019.
- "Pitsea East". Basildon District Council. Archived from the original on 25 May 2001. Retrieved 12 October 2019.
- "Pitsea West". Basildon District Council. Archived from the original on 25 May 2001. Retrieved 12 October 2019.
- "Vange". Basildon District Council. Archived from the original on 24 May 2001. Retrieved 12 October 2019.
- "Wickford North". Basildon District Council. Archived from the original on 18 November 2001. Retrieved 12 October 2019.
- "Wickford South". Basildon District Council. Archived from the original on 6 October 2001. Retrieved 12 October 2019.