For related races, see 2006 United States gubernatorial elections.
| |||||||||||||||||
| Turnout | 60.47% | ||||||||||||||||
|---|---|---|---|---|---|---|---|---|---|---|---|---|---|---|---|---|---|
| |||||||||||||||||
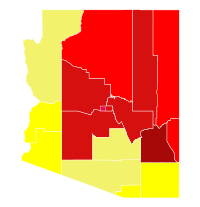
 County results County resultsNapolitano: 50–60% 60–70% 70–80% | |||||||||||||||||
| |||||||||||||||||
The 2006 Arizona gubernatorial election was held on November 7, 2006. Incumbent Governor Janet Napolitano was reelected in a landslide. Napolitano's widespread popularity contributed to her easy reelection; her general approval rating in October 2006, one month before the election, was at 58%.
This was the last time until 2022 that a Democrat was elected governor of Arizona. It is also the last time that a Democrat swept every county in the state in a statewide election.
Democratic primary
Candidates
- Janet Napolitano, incumbent governor of Arizona
Results
| Party | Candidate | Votes | % | |
|---|---|---|---|---|
| Democratic | Janet Napolitano (incumbent) | 230,881 | 100.00% | |
| Total votes | 230,881 | 100.00% | ||
Republican primary
Candidates
- Don Goldwater, activist, former board member of the Goldwater Institute and nephew of Barry Goldwater
- Mike Harris, businessman
- Len Munsil, former president of the Center for Arizona Policy (CAP)
- Gary Tupper, contractor
Results

- 61–70%
- 51–60%
- 41–50%
- 51–60%
- 41–50%
| Party | Candidate | Votes | % | |
|---|---|---|---|---|
| Republican | Len Munsil | 155,778 | 50.56% | |
| Republican | Don Goldwater | 122,283 | 39.39% | |
| Republican | Mike Harris | 18,734 | 6.08% | |
| Republican | Gary Tupper | 11,250 | 3.65% | |
| Republican | Steve Moore (write-in) | 49 | 0.2% | |
| Total votes | 308,094 | 100.00% | ||
Libertarian primary
Candidates
- Barry Hess, currency speculator and perennial candidate
Results
| Party | Candidate | Votes | % | |
|---|---|---|---|---|
| Libertarian | Barry Hess | 3,063 | 100.00% | |
| Total votes | 3,063 | 100.00% | ||
General election
Predictions
| Source | Ranking | As of |
|---|---|---|
| The Cook Political Report | Solid D | November 6, 2006 |
| Sabato's Crystal Ball | Safe D | November 6, 2006 |
| Rothenberg Political Report | Safe D | November 2, 2006 |
| Real Clear Politics | Safe D | November 6, 2006 |
Polling
| Source | Date released | Janet Napolitano (D) |
Len Munsil (R) |
|---|---|---|---|
| Survey USA | November 3, 2006 | 57% | 38% |
| Rasmussen | October 19, 2006 | 58% | 37% |
| Survey USA | October 17, 2006 | 56% | 37% |
| Rasmussen | September 26, 2006 | 56% | 38% |
| Survey USA | September 19, 2006 | 56% | 40% |
| Zogby/WSJ | September 11, 2006 | 51.3% | 41.1% |
| Rasmussen | August 31, 2006 | 52% | 33% |
| Zogby/WSJ | August 28, 2006 | 51.7% | 38.0% |
| Rasmussen | August 2, 2006 | 53% | 35% |
| Zogby/WSJ | July 24, 2006 | 49.6% | 38.7% |
| Zogby/WSJ | June 21, 2006 | 48.7% | 32.8% |
| Rasmussen | June 12, 2006 | 58% | 29% |
| Rasmussen | April 30, 2006 | 55% | 28% |
Results
| Party | Candidate | Votes | % | ±% | |
|---|---|---|---|---|---|
| Democratic | Janet Napolitano (incumbent) | 959,830 | 62.58% | +16.40% | |
| Republican | Len Munsil | 543,528 | 35.44% | −9.78% | |
| Libertarian | Barry Hess | 30,268 | 1.97% | +0.31% | |
| Independent | Arthur Ray Arvizu (write-in) | 10 | 0.00% | ||
| Independent | Brian Wright (write-in) | 6 | 0.00% | ||
| Independent | Robert B. Winn (write-in) | 3 | 0.00% | ||
| Majority | 416,302 | 27.14% | |||
| Total votes | 1,533,645 | 100.00% | |||
| Democratic hold | Swing | +26.18% | |||
Results by county
| County | Janet Napolitano Democratic |
Len Munsil Republican |
Barry Hess Libertarian |
All others Write-in |
Margin | Total votes cast | |||||
|---|---|---|---|---|---|---|---|---|---|---|---|
| # | % | # | % | # | % | # | % | # | % | ||
| Apache | 14,475 | 77.02% | 3,627 | 19.30% | 692 | 3.68% | 1 | 0.01% | 10,848 | 57.72% | 18,795 |
| Cochise | 21,416 | 58.87% | 14,038 | 38.59% | 922 | 2.53% | 1 | 0.00% | 7,378 | 20.28% | 36,377 |
| Coconino | 28,551 | 74.54% | 8,879 | 23.18% | 872 | 2.28% | 2 | 0.01% | 19,672 | 51.36% | 38,304 |
| Gila | 10,586 | 63.21% | 5,803 | 34.65% | 358 | 2.14% | 0 | 0.00% | 4,783 | 28.56% | 16,747 |
| Graham | 4,348 | 55.64% | 3,306 | 42.30% | 161 | 2.06% | 0 | 0.00% | 1,042 | 13.33% | 7,815 |
| Greenlee | 1,486 | 69.70% | 588 | 27.58% | 58 | 2.72% | 0 | 0.00% | 898 | 42.12% | 2,132 |
| La Paz | 2,353 | 61.39% | 1,342 | 35.01% | 138 | 3.60% | 0 | 0.00% | 1,011 | 26.38% | 3,833 |
| Maricopa | 538,383 | 60.64% | 332,570 | 37.46% | 16,888 | 1.90% | 12 | 0.00% | 205,813 | 23.18% | 887,853 |
| Mohave | 25,400 | 55.08% | 19,588 | 42.47% | 1,129 | 2.45% | 1 | 0.00% | 5,812 | 12.60% | 46,118 |
| Navajo | 17,368 | 64.97% | 8,708 | 32.57% | 658 | 2.46% | 0 | 0.00% | 8,660 | 32.39% | 26,734 |
| Pima | 195,305 | 69.22% | 82,052 | 29.08% | 4,794 | 1.70% | 0 | 0.00% | 113,253 | 40.14% | 282,151 |
| Pinal | 35,428 | 61.87% | 20,716 | 36.18% | 1,116 | 1.95% | 1 | 0.00% | 14,712 | 25.69% | 57,261 |
| Santa Cruz | 6,482 | 78.32% | 1,634 | 19.74% | 160 | 1.93% | 0 | 0.00% | 4,848 | 58.58% | 8,276 |
| Yavapai | 40,848 | 56.23% | 30,203 | 41.58% | 1,587 | 2.18% | 1 | 0.00% | 10,645 | 14.65% | 72,639 |
| Yuma | 17,401 | 60.82% | 10,474 | 36.61% | 735 | 2.57% | 0 | 0.00% | 6,927 | 24.21% | 28,610 |
| Totals | 959,830 | 62.58% | 543,528 | 35.44% | 30,268 | 1.97% | 19 | 0.00% | 416,302 | 27.14% | 1,533,645 |
Counties that flipped from Republican to Democratic
- Cochise (largest city: Sierra Vista)
- Graham (largest city: Safford)
- La Paz (largest city: Parker)
- Maricopa (largest city: Phoenix)
- Mohave (largest city: Lake Havasu City)
- Yavapai (largest city: Prescott Valley)
- Yuma (largest city: Yuma)
See also
References
- "Voter Registration Statistics | Arizona Secretary of State". Retrieved May 7, 2023.
- "SurveyUSA | America's Neighborhood Pollster".
- ^ "State of Arizona Official Canvass 2006 Primary Election - September 12, 2006" (PDF). Arizona Secretary of State. Retrieved July 14, 2024.
- "2006 Governor Race Ratings for November 6, 2006" (PDF). The Cook Political Report. Archived from the original (PDF) on June 5, 2008. Retrieved October 1, 2006.
- "Election Eve 2006: THE FINAL PREDICTIONS". Sabato's Crystal Ball. Retrieved June 25, 2021.
- "2006 Gubernatorial Ratings". Senate Ratings. The Rothenberg Political Report. Retrieved June 25, 2021.
- "Election 2006". Real Clear Politics. Retrieved June 25, 2021.
- Survey USA
- Rasmussen
- Survey USA
- Rasmussen
- Survey USA
- ^ Zogby/WSJ
- Rasmussen
- Rasmussen Archived 2006-09-22 at the Wayback Machine
- Rasmussen
- Rasmussen
- ^ "State of Arizona Official Canvass 2006 General Election - November 7, 2006" (PDF). Arizona Secretary of State. Retrieved July 14, 2024.
External links
Official campaign websites (archived)
| Governor | |||||
|---|---|---|---|---|---|
| Attorney General | |||||
| Secretary of State | |||||
| State Treasurer | |||||
| Superintendent of Public Instruction | |||||
| U.S. President | |||||
| U.S. Senate |
| ||||
| U.S. House | |||||
| See also: Political party strength in Arizona | |||||
| (2002 ←) 2006 Arizona elections (→ 2010) | |
|---|---|
| (2005 ←) 2006 United States elections (→ 2007) | |
|---|---|
| U.S. Senate |
|
| U.S. House (election ratings) |
|
| Governors |
|
| State Attorneys General | |
| State officials | |
| State legislatures |
|
| Mayors | |
| States |
|


