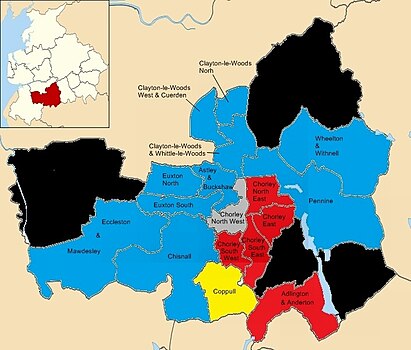
Main article: Chorley Borough Council elections
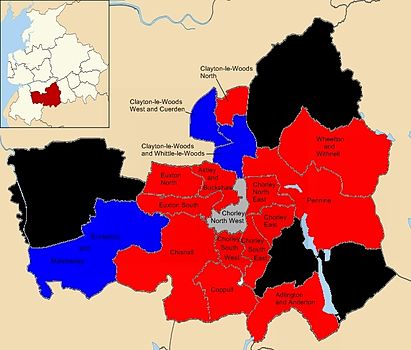
The 2014 Chorley Borough Council election took place on 22 May 2014 to elect members of Chorley Borough Council in England. This was on the same day as other local elections. One third of the council was up for election and the Labour party held control.
Council make-up
After the election, the composition of the council was:
| Party | Seats | Current Council (2014) | ||||||||||||||||||||||||||||||||||||||||||||||||||
|---|---|---|---|---|---|---|---|---|---|---|---|---|---|---|---|---|---|---|---|---|---|---|---|---|---|---|---|---|---|---|---|---|---|---|---|---|---|---|---|---|---|---|---|---|---|---|---|---|---|---|---|---|
| 2010 | 2011 | 2012 | 2014 | |||||||||||||||||||||||||||||||||||||||||||||||||
| Labour | 15 | 20 | 24 | 32 | ||||||||||||||||||||||||||||||||||||||||||||||||
| Conservative | 27 | 23 | 20 | 13 | ||||||||||||||||||||||||||||||||||||||||||||||||
| Independent | 2 | 2 | 2 | 2 | ||||||||||||||||||||||||||||||||||||||||||||||||
| Lib Dems | 3 | 2 | 1 | 0 | ||||||||||||||||||||||||||||||||||||||||||||||||
Election result
| Party | Seats | Gains | Losses | Net gain/loss | Seats % | Votes % | Votes | +/− | |
|---|---|---|---|---|---|---|---|---|---|
| Labour | 13 | 8 | 0 | 76.5 | 46.2 | 13,908 | +7.2 | ||
| Conservative | 3 | 0 | 7 | 17.6 | 32.2 | 9,706 | −6.8 | ||
| Independent | 1 | 0 | 0 | 5.9 | 7.8 | 2,354 | −0.2 | ||
| UKIP | 0 | 0 | 0 | 0 | 11.5 | 3,547 | +10.5 | ||
| Liberal Democrats | 0 | 0 | 1 | 0 | 1.4 | 424 | −10.6 | ||
| Green | 0 | 0 | 0 | 0 | 0.5 | 160 | +0.0 | ||
Results map
 |
 |
Wards
Adlington and Anderton
| Party | Candidate | Votes | % | ±% | |
|---|---|---|---|---|---|
| Labour | Graham Dunn | 1,126 | 48.3 | −9.7 | |
| Conservative | Charlotte Woods | 607 | 26.1 | −3.9 | |
| UKIP | Hayden Clewlow | 520 | 22.3 | N/A | |
| Liberal Democrats | Philip William Pilling | 76 | 3.3 | −9.7 | |
| Majority | 519 | 22.3 | |||
| Turnout | 2,329 | 40.8 | |||
| Labour hold | Swing | ||||
Astley and Buckshaw ward
| Party | Candidate | Votes | % | ±% | |
|---|---|---|---|---|---|
| Labour | Matthew John Lynch | 788 | 47.1 | +1.1 | |
| Conservative | Alan Platt | 621 | 37.1 | −16.9 | |
| UKIP | Jeffrey Flinders Mallinson | 265 | 15.8 | N/A | |
| Majority | 167 | 10.0 | |||
| Turnout | 1,674 | 43.0 | |||
| Labour gain from Conservative | Swing | +9.0 | |||
Chisnall ward
| Party | Candidate | Votes | % | ±% | |
|---|---|---|---|---|---|
| Labour | Alan Whittaker | 848 | 57.1 | +24.1 | |
| Conservative | Harold Heaton | 637 | 42.9 | −8.1 | |
| Majority | 211 | 14.2 | |||
| Turnout | 1,485 | 45.7 | |||
| Labour gain from Conservative | Swing | ||||
Chorley East ward
| Party | Candidate | Votes | % | ±% | |
|---|---|---|---|---|---|
| Labour | Hasina Khan | 1,008 | 56.9 | −1.1 | |
| UKIP | Christopher Suart | 435 | 24.6 | N/A | |
| Conservative | Alan Cullens | 223 | 12.6 | −11.4 | |
| Independent | Melville George Coombes | 97 | 5.5 | −14.5 | |
| Green | Anne Calderbank | 18 | 1.0 | N/A | |
| Majority | 573 | 32.4 | |||
| Turnout | 1,771 | 36.0 | |||
| Labour hold | Swing | ||||
Chorley North East ward
| Party | Candidate | Votes | % | ±% | |
|---|---|---|---|---|---|
| Labour | Alistair William Morwood | 1,162 | 69.1 | −2 | |
| Conservative | Matt Hansford | 519 | 30.9 | −15 | |
| Majority | 643 | 38.2 | |||
| Turnout | 1,681 | 35.0 | |||
| Labour hold | Swing | +7 | |||
Chorley North West ward
| Party | Candidate | Votes | % | ±% | |
|---|---|---|---|---|---|
| Independent | Ralph Snape | 1,787 | 72.5 | −10.5 | |
| Labour | Aaron Beaver | 400 | 16.2 | N/A | |
| Conservative | Peter Malpas | 276 | 11.2 | −0.9 | |
| Majority | 1,387 | 52 | |||
| Turnout | 2,463 | 52.2 | |||
| Independent hold | Swing | ||||
Chorley South East ward
| Party | Candidate | Votes | % | ±% | |
|---|---|---|---|---|---|
| Labour | Mrs. Beverley Murray | 968 | 49.0 | +3.6 | |
| Conservative | Mrs. Sarah Louise Kiley | 504 | 25.5 | −9.1 | |
| UKIP | David John McManus | 392 | 19.8 | N/A | |
| Green | Alistair James Straw | 66 | 3.3 | −1.0 | |
| Liberal Democrats | David Porter | 47 | 2.4 | −13.3 | |
| Majority | 464 | 23.5 | |||
| Turnout | 1,977 | 36.2 | |||
| Labour hold | Swing | ||||
Chorley South West ward
| Party | Candidate | Votes | % | ±% | |
|---|---|---|---|---|---|
| Labour | Roy Lees | 1,184 | 67.3 | +20.3 | |
| Conservative | Dominic Keiran Jewell | 575 | 32.7 | −0.3 | |
| Majority | 609 | 34.6 | |||
| Turnout | 1,759 | 30.7 | |||
| Labour hold | Swing | +10.6 | |||
Clayton le Woods and Whittle le Woods ward
| Party | Candidate | Votes | % | ±% | |
|---|---|---|---|---|---|
| Conservative | Eric Bell | 1,409 | 58.6 | +3.6 | |
| Labour | Dan Croft | 703 | 41.4 | +17.4 | |
| Liberal Democrats | Glenda Charlesworth | 205 | 2.4 | −18.6 | |
| Majority | 706 | 17.3 | |||
| Turnout | 2,317 | 36.0 | |||
| Conservative hold | Swing | ||||
Clayton le Woods North ward
| Party | Candidate | Votes | % | ±% | |
|---|---|---|---|---|---|
| Labour | Charlie Bromilow | 732 | 58.4 | +24.4 | |
| Conservative | Chris Morris | 480 | 41.6 | +3.6 | |
| UKIP | Raymond McGrady | 458 | 19.8 | N/A | |
| Liberal Democrats | Stephen John Fenn | 96 | 2.4 | −25.6 | |
| Green | Mark Lee | 76 | 9.3 | N/A | |
| Majority | 289 | 17 | +8 | ||
| Turnout | 1,711 | 34.5 | |||
| Labour gain from Conservative | Swing | +4 | |||
Clayton le Woods West and Cuerden ward
| Party | Candidate | Votes | % | ±% | |
|---|---|---|---|---|---|
| Conservative | Mick Muncaster | 736 | 51.2 | −3.8 | |
| Labour | Paul Clark | 701 | 48.8 | +3.8 | |
| Majority | 35 | 2.4 | |||
| Turnout | 1,437 | 43.0 | |||
| Conservative hold | Swing | −3.8 | |||
Coppull ward
| Party | Candidate | Votes | % | ±% | |
|---|---|---|---|---|---|
| Labour | Richard Toon | 885 | 57.3 | +24.1 | |
| Independent | Kenneth William Ball | 470 | 16.5 | N/A | |
| UKIP | Mark Smith | 383 | 19.8 | N/A | |
| Conservative | Tom Norris | 181 | 11.3 | −5.7 | |
| Majority | 462 | 26.1 | |||
| Turnout | 1,919 | 39.0 | |||
| Labour gain from Liberal Democrats | Swing | ||||
Eccleston and Mawdesley ward
| Party | Candidate | Votes | % | ±% | |
|---|---|---|---|---|---|
| Conservative | Keith Iddon | 944 | 46.6 | −11.4 | |
| Labour | Stan Ely | 741 | 42.2 | +0.2 | |
| UKIP | Richard George Croll | 402 | 11.1 | N/A | |
| Majority | 203 | 4.4 | −10 | ||
| Turnout | 2,164 | 43.0 | |||
| Conservative hold | Swing | −5.8 | |||
Euxton North ward
| Party | Candidate | Votes | % | ±% | |
|---|---|---|---|---|---|
| Labour | Mike Handley | 692 | 53.8 | +6.7 | |
| Conservative | Robert Aron Wilding | 570 | 34.9 | −12.1 | |
| UKIP | Stuart Rickaby | 289 | 11.4 | N/A | |
| Majority | 122 | 18.9 | |||
| Turnout | 1,551 | 44.3 | |||
| Labour gain from Conservative | Swing | +9.4 | |||
Euxton South ward
| Party | Candidate | Votes | % | ±% | |
|---|---|---|---|---|---|
| Labour | Mark Andrew Jarnell | 572 | 40.2 | +13.8 | |
| Conservative | Debra Platt | 569 | 40.0 | −25.1 | |
| UKIP | David Smithies | 283 | 19.9 | N/A | |
| Majority | 3 | 0.2 | |||
| Turnout | 1,424 | 44.7 | |||
| Labour gain from Conservative | Swing | +19.5 | |||
Pennine
| Party | Candidate | Votes | % | ±% | |
|---|---|---|---|---|---|
| Labour | Gordon France | 354 | 44.3 | +6.3 | |
| Conservative | Marie Elizabeth Gray | 325 | 40.7 | −21.3 | |
| UKIP | Tom Shorrock | 120 | 15.0 | N/A | |
| Majority | 29 | 3.6 | |||
| Turnout | 799 | 46.0 | |||
| Labour gain from Conservative | Swing | ||||
Wheelton and Withnell ward
| Party | Candidate | Votes | % | ±% | |
|---|---|---|---|---|---|
| Labour | Margaret Mary France | 1,044 | 66.3 | +19.1 | |
| Conservative | Alison Marie Hansford | 530 | 33.7 | −19.1 | |
| Majority | 514 | 32.7 | |||
| Turnout | 1,574 | 49.4 | |||
| Labour gain from Conservative | Swing | +19.1 | |||
References
- "England council results". BBC News. Retrieved 23 May 2014.
| Lancashire County Council | |
|---|---|
| Blackburn with Darwen | |
| Blackpool | |
| Burnley | |
| Chorley | |
| Fylde | |
| Hyndburn | |
| Lancaster | |
| Pendle | |
| Preston | |
| Ribble Valley | |
| Rossendale | |
| South Ribble | |
| West Lancashire | |
| Wyre | |
| |