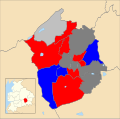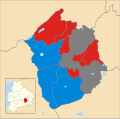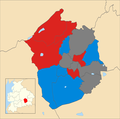
Hyndburn Borough Council elections are generally held three years out of every four, with a third of the council elected each time. Hyndburn Borough Council is the local authority for the non-metropolitan district of Hyndburn in Lancashire, England. Since the last boundary changes in 2002, 35 councillors have been elected from 16 wards.
Council elections
Elections are usually by thirds, in three of every four years.
| Year/Party | Labour | LibDems | Cons | Indep | UKIP | Other | Controlling party | Notes | ||||||
|---|---|---|---|---|---|---|---|---|---|---|---|---|---|---|
| 1973 | 24 | 3 | 21 | NOC | ||||||||||
| 1976 | 14 | 1 | 33 | Conservatives | ||||||||||
| 1979 | 19 | 28 | Conservatives | New ward boundaries. Councillors reduced from 48 to 47 and all out election. | ||||||||||
| 1980 | 27 | 20 | Labour | |||||||||||
| 1982 | 26 | 1 | 20 | Labour | ||||||||||
| 1983 | 25 | 2 | 20 | Labour | ||||||||||
| 1984 | 20 | 3 | 24 | Conservatives | ||||||||||
| 1986 | 25 | 6 | 16 | Labour | ||||||||||
| 1987 | 26 | 7 | 14 | Labour | Borough boundary changes took place but the number of seats remained the same. | |||||||||
| 1988 | 25 | 6 | 16 | Labour | ||||||||||
| 1990 | 29 | 4 | 13 | 1 | Labour | |||||||||
| 1991 | 34 | 3 | 9 | 1 | Labour | |||||||||
| 1992 | 32 | 3 | 12 | Labour | ||||||||||
| 1994 | 33 | 1 | 13 | Labour | ||||||||||
| 1995 | 36 | 1 | 10 | Labour | ||||||||||
| 1996 | 44 | 3 | Labour | |||||||||||
| 1998 | 35 | 12 | Labour | |||||||||||
| 1999 | 23 | 23 | 1 | NOC | ||||||||||
| 2000 | 16 | 31 | Conservative | |||||||||||
| 2002 | 18 | 17 | Labour | New ward boundaries. Councillors reduced from 47 to 35 and all out election. | ||||||||||
| 2003 | 17 | 18 | Conservative | |||||||||||
| 2004 | 15 | 20 | Conservative | |||||||||||
| 2006 | 16 | 18 | 1 | Conservative | ||||||||||
| 2007 | 15 | 18 | 2 | Conservative | ||||||||||
| 2008 | 13 | 18 | 4 | Conservative | ||||||||||
| 2010 | 14 | 17 | 4 | NOC | ||||||||||
| 2011 | 18 | 14 | 3 | Labour | ||||||||||
| 2012 | 23 | 9 | 3 | Labour | ||||||||||
| 2014 | 23 | 8 | 2 | 2 | Labour | |||||||||
| 2015 | 24 | 8 | 0 | 2 | Labour | |||||||||
| 2016 | 26 | 7 | 2 | Labour | ||||||||||
| 2018 | 26 | 9 | 0 | Labour | ||||||||||
| 2019 | 26 | 9 | Labour | |||||||||||
| 2021 | 22 | 12 | 1 | Labour | ||||||||||
| 2022 | 14 | 14 | 6 | NOC | ||||||||||
| 2023 | 16 | 16 | 1 | 2 | NOC | |||||||||
| 2024 | 22 | 11 | 1 | 1 | Labour | |||||||||
Borough result maps
-
 2010 results map
-
 2011 results map
-
 2012 results map
-
 2014 results map
-
 2015 results map
-
 2016 results map
-
 2018 results map
-
 2019 results map
-
 2021 results map
-
 2022 results map
-
 2023 results map
-
 2024 results map
By-election results
1998-2002
| Party | Candidate | Votes | % | ±% | |
|---|---|---|---|---|---|
| Labour | 702 | 61.7 | +14.8 | ||
| Conservative | 436 | 38.3 | −14.8 | ||
| Majority | 266 | 23.4 | |||
| Turnout | 1,138 | 31.9 | |||
| Labour gain from Independent | Swing | ||||
| Party | Candidate | Votes | % | ±% | |
|---|---|---|---|---|---|
| Labour | 339 | 64.1 | +12.9 | ||
| Conservative | 190 | 35.9 | +35.9 | ||
| Majority | 149 | 28.2 | |||
| Turnout | 529 | 16.5 | |||
| Labour gain from Conservative | Swing | ||||
| Party | Candidate | Votes | % | ±% | |
|---|---|---|---|---|---|
| Labour | 387 | 53.8 | +11.2 | ||
| Conservative | 333 | 46.2 | −11.2 | ||
| Majority | 54 | 7.6 | |||
| Turnout | 720 | 19.5 | |||
| Labour gain from Conservative | Swing | ||||
2002-2006
| Party | Candidate | Votes | % | ±% | |
|---|---|---|---|---|---|
| Labour | Claire Hamilton | 759 | 46.1 | +5.6 | |
| Conservative | Stan Horne | 756 | 46.0 | −13.5 | |
| Liberal Democrats | Bill Greene | 129 | 7.8 | +7.8 | |
| Majority | 3 | 0.1 | |||
| Turnout | 1,644 | 32.2 | |||
| Labour gain from Conservative | Swing | ||||
| Party | Candidate | Votes | % | ±% | |
|---|---|---|---|---|---|
| Labour | Susan Shorrock | 774 | 47.5 | +2.6 | |
| Conservative | Roy Atkinson | 593 | 36.4 | −18.7 | |
| BNP | Carrie Cassidy | 191 | 11.7 | +11.7 | |
| Liberal Democrats | Bill Greene | 72 | 4.4 | +4.4 | |
| Majority | 178 | 11.1 | |||
| Turnout | 1,630 | 32.6 | |||
| Labour gain from Conservative | Swing | ||||
2006-2010
| Party | Candidate | Votes | % | ±% | |
|---|---|---|---|---|---|
| Labour | Munsif Dad | 528 | 68.1 | −3.2 | |
| Conservative | Michaek Szewczuk | 247 | 31.9 | +3.2 | |
| Majority | 281 | 36.2 | |||
| Turnout | 775 | 22.1 | |||
| Labour hold | Swing | ||||
| Party | Candidate | Votes | % | ±% | |
|---|---|---|---|---|---|
| Labour | Harry Grayson | 1,112 | 55.2 | +5.9 | |
| Conservative | Stan Horne | 848 | 42.1 | −9.6 | |
| Liberal Democrats | Bill Green | 54 | 2.7 | +2.7 | |
| Majority | 264 | 13.1 | |||
| Turnout | 2,014 | 39.7 | |||
| Labour gain from Conservative | Swing | ||||
2010-2014
| Party | Candidate | Votes | % | ±% | |
|---|---|---|---|---|---|
| Labour | Wendy Dwyer | 592 | 75.8 | TBC | |
| Conservative | Danny Cassidy | 189 | 24.2 | TBC | |
| Majority | 403 | 51.6 | TBC | ||
| Turnout | 781 | 25.7 | TBC | ||
| Labour hold | Swing | TBC | |||
| Party | Candidate | Votes | % | ±% | |
|---|---|---|---|---|---|
| Conservative | Terry Hurn | 693 | 58.2 | TBC | |
| Labour | David Hartley | 434 | 36.4 | TBC | |
| Independent | Lesley Wolstencroft | 47 | 3.9 | TBC | |
| UKIP | Bobby Anwar | 17 | 1.4 | TBC | |
| Majority | 259 | 21.7 | TBC | ||
| Turnout | 1,191 | 36 | TBC | ||
| Conservative hold | Swing | TBC | |||
| Party | Candidate | Votes | % | ±% | |
|---|---|---|---|---|---|
| Labour | Diane Fielding | 678 | 51.7 | TBC | |
| Conservative | Mohammed Sadfar | 475 | 36.2 | TBC | |
| UKIP | Ken Smith | 137 | 10.4 | TBC | |
| Green | Kerry Gormley | 17 | 1.3 | TBC | |
| Majority | 203 | 15.5 | TBC | ||
| Turnout | 1312 | TBC | TBC | ||
| Labour hold | Swing | ||||
2022-2026
| Party | Candidate | Votes | % | ±% | |
|---|---|---|---|---|---|
| Labour | Colin McKenzie | 773 | 52.2 | +6.4 | |
| Conservative | Liz McGinley | 600 | 40.5 | −0.1 | |
| Independent | Michael Miller | 71 | 4.8 | +4.8 | |
| Reform UK | Richard Oakley | 36 | 2.4 | −10.1 | |
| Majority | 173 | 11.7 | +6.5 | ||
| Turnout | 1,482 | 31.32 | |||
| Labour hold | Swing | ||||
| Party | Candidate | Votes | % | ±% | |
|---|---|---|---|---|---|
| Labour | TBC | ||||
| Conservative | David Heap | ||||
| Majority | |||||
| Turnout | |||||
| Labour hold | Swing | ||||
References
- ^ "The Borough of Hyndburn (Electoral Changes) Order 2001", legislation.gov.uk, The National Archives, SI 2001/2469, retrieved 24 August 2022
- The Borough of Hyndburn (Electoral Arrangements) Order 1976
- The Lancashire (District Boundaries) Order 1986
- "By-election won by student, 21". Lancashire Evening Telegraph. 18 March 2005. Archived from the original on 20 April 2013. Retrieved 14 September 2009.
- "Labour candidate wins by-election victory". Blackburn Citizen. 22 September 2006. Retrieved 14 September 2009.
- "Labour gains, Conservative pains". HyndburnOnline.com. 6 November 2006. Archived from the original on 12 July 2011. Retrieved 14 September 2009.
- By-election results Archived 29 March 2010 at the Wayback Machine
External links
- Hyndburn Borough Council Archived 30 May 2006 at the Wayback Machine
| Lancashire County Council | |
|---|---|
| Blackburn with Darwen | |
| Blackpool | |
| Burnley | |
| Chorley | |
| Fylde | |
| Hyndburn | |
| Lancaster | |
| Pendle | |
| Preston | |
| Ribble Valley | |
| Rossendale | |
| South Ribble | |
| West Lancashire | |
| Wyre | |
| |
| Culture and infrastructure of the Borough of Hyndburn | |||||||
|---|---|---|---|---|---|---|---|
| Transport |
| ||||||
| Sport | |||||||
| Media | |||||||
| Education | |||||||
| Companies | |||||||
| History | |||||||
| Politics |
| ||||||