| Ohio's 7th congressional district | |
|---|---|
 Interactive map of district boundaries since January 3, 2023 Interactive map of district boundaries since January 3, 2023 | |
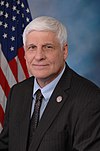
| Representative | Max Miller R–Rocky River |
| Population (2023) | 769,701 |
| Median household income | $80,983 |
| Ethnicity |
|
| Cook PVI | R+7 |
Ohio's 7th congressional district is represented by Max Miller. It is currently located in the northeastern section of the state, including southern and western Cuyahoga County, all of Medina and Wayne Counties, and a sliver of northern Holmes County.
Recent election results from statewide races
| Year | Office | Results |
|---|---|---|
| 2008 | President | McCain 50% - 49% |
| 2012 | President | Romney 52% - 48% |
| 2016 | President | Trump 54% - 42% |
| Senate | Portman 61% - 34% | |
| 2018 | Senate | Brown 52% - 48% |
| Governor | DeWine 52% - 45% | |
| Attorney General | Yost 52% - 48% | |
| 2020 | President | Trump 54% - 45% |
| 2022 | Senate | Vance 52% - 48% |
| Governor | DeWine 63% - 37% | |
| Secretary of State | LaRose 59% - 40% | |
| Treasurer | Sprague 59% - 41% | |
| Auditor | Faber 59% - 41% | |
| Attorney General | Yost 60% - 40% | |
| 2024 | President | Trump 55% - 44% |
| Senate | Moreno 49% - 48% |
Composition
| # | County | Seat | Population |
|---|---|---|---|
| 35 | Cuyahoga | Cleveland | 1,233,088 |
| 75 | Holmes | Millersburg | 44,386 |
| 103 | Medina | Medina | 184,042 |
| 169 | Wayne | Wooster | 116,510 |
Cities and CDPs with 10,000 or more people
- Parma – 81,146
- Strongsville – 46,491
- Brunswick – 35,426
- Westlake – 34,228
- North Olmsted – 32,442
- North Royalton – 31,322
- Wooster – 27,232
- Medina – 26,033
- Solon – 24,262
- Wadsworth – 24,007
- Rocky River – 21,755
- Parma Heights – 20,863
- Broadview Heights – 19,634
- Brook Park – 18,063
- Berea – 17,922
- Fairview Park – 16,785
- Middleburg Heights – 16,004
- Bay Village – 15,810
- Brecksville – 13,850
- Seven Hills – 11,720
- Norton – 11,673
- Brooklyn – 11,022
2,500 – 10,000 people
- Olmsted Falls – 8,628
- Orrville – 8,452
- Independence – 7,584
- Rittman – 6,131
- Chagrin Falls – 4,087
- Oakwood – 3,572
- Doylestown – 3,053
- Loudonville – 2,786
- Lodi – 2,746
List of members representing the district
Recent election results
The following chart shows historic election results. Bold type indicates victor. Italic type indicates incumbent.
Historical district boundaries


See also
References
- "My Congressional District".
- "My Congressional District".
- "2022 Cook PVI: District Map and List". Cook Political Report. July 12, 2022. Retrieved January 10, 2023.
- https://davesredistricting.org/maps#viewmap::64d56870-70ea-4f4d-b667-9a4fd60ac511
- https://opoliticsguru.github.io/2024-Presidential-Election-Results-Ohio/#6/42.253/-77.783
- "2024 U.S. Senate Election in Ohio: Official Results".
- "2012 Election Results". Ohio Secretary of State.
- "2014 Elections Results - Ohio Secretary of State". www.sos.state.oh.us. Retrieved October 7, 2020.
- "2016 Official Elections Results - Ohio Secretary of State". www.sos.state.oh.us. Retrieved October 7, 2020.
- "2018 Official Elections Results - Ohio Secretary of State". www.sos.state.oh.us. Retrieved October 7, 2020.
- Martis, Kenneth C. (1989). The Historical Atlas of Political Parties in the United States Congress. New York: Macmillan Publishing Company.
- Martis, Kenneth C. (1982). The Historical Atlas of United States Congressional Districts. New York: Macmillan Publishing Company.
- Congressional Biographical Directory of the United States 1774–present
| Ohio's congressional districts | |
|---|---|
|
40°28′52″N 82°23′35″W / 40.48111°N 82.39306°W / 40.48111; -82.39306
Categories: