Misplaced Pages

Georgia's 5th congressional district

Article snapshot taken from Wikipedia with creative commons attribution-sharealike license. Give it a read and then ask your questions in the chat. We can research this topic together.
(Redirected from GA-05) U.S. House district for Georgia

"GA-5" redirects here. For the state route, see Georgia State Route 5.
Georgia's 5th congressional district
Interactive map of district boundaries since January 3, 2025
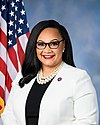
RepresentativeNikema Williams
DAtlanta
Distribution
  • 99.97% urban
  • 0.03% rural
Population (2023)774,627
Median household
income
$84,016
Ethnicity
Cook PVID+32

Georgia's 5th congressional district is a congressional district in the U.S. state of Georgia. The district was represented by Democrat John Lewis from January 3, 1987, until his death on July 17, 2020. Kwanza Hall was elected to replace Lewis on December 1, 2020, and served until January 3, 2021, when Nikema Williams took his place. Hall was elected in a special election for the balance of Lewis' 17th term. He chose not to run in the general election for a full two-year term, which was won by Williams.

Reapportionment

The district's boundaries were redrawn following the 2010 census, which granted an additional congressional seat to Georgia. The first election using the new district boundaries (listed below) were the 2012 congressional elections.

Geography

Based in central Fulton and parts of DeKalb and Clayton counties, the majority black district includes almost three-fourths of Atlanta, the state capital and largest city. It also includes some of the surrounding suburbs, including East Point, Druid Hills, and Forest Park. With a Cook Partisan Voting Index rating of D+32, it is the most Democratic district in Georgia.

Composition

# County Seat Population
63 Clayton Jonesboro 298,300
89 DeKalb Decatur 762,992
121 Fulton Atlanta 1,079,105

Cities with 10,000 or more people

2,500-10,000 people

Recent results in statewide elections

Year Office Results
2000 President Al Gore 73% - George W. Bush 27%
2004 President John Kerry 74% - George W. Bush 26%
2008 President Barack Obama 84.4% - John McCain 15%
2012 President Barack Obama 83.1% - Mitt Romney 15.8%
2016 President Hillary Clinton 85% - Donald Trump 12%
2018 Governor Stacey Abrams 87.9% - Brian Kemp 11.3%
2020 President Joe Biden 86% - Donald Trump 13%

List of members representing the district

Member Party Years Cong
ress
Electoral history District map
District created March 4, 1827
Charles Eaton Haynes
(Sparta)
Jacksonian March 4, 1827 –
March 3, 1829
20th Redistricted from the at-large district and re-elected in 1826.
Redistricted to the at-large district.
District inactive March 4, 1829 –
March 3, 1845

John Henry Lumpkin
(Rome)
Democratic March 4, 1845 –
March 3, 1849
29th
30th
Elected in 1844.
Re-elected in 1846.
[data missing]
Thomas C. Hackett
(Rome)
Democratic March 4, 1849 –
March 3, 1851
31st Elected in 1848.
[data missing]
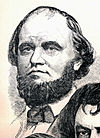
Elijah Webb Chastain
(Toccoa)
Constitutional Union March 4, 1851 –
March 3, 1853
32nd
33rd
Elected in 1851.
Re-elected in 1853.
[data missing]
Democratic March 4, 1853 –
March 3, 1855

John Henry Lumpkin
(Rome)
Democratic March 4, 1855 –
March 3, 1857
34th Elected in 1855.
[data missing]

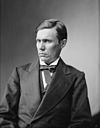
Augustus R. Wright
(Rome)
Democratic March 4, 1857 –
March 3, 1859
35th Elected in 1857.
[data missing]

John William
Henderson Underwood

(Rome)
Democratic March 4, 1859 –
January 23, 1861
36th Elected in 1859.
Withdrew.
Vacant January 23, 1861 –
July 25, 1868
36th
37th
38th
39th
40th
Civil War and Reconstruction

Charles H. Prince
(Augusta)
Republican July 25, 1868 –
March 3, 1869
40th Elected to finish the term.
[data missing]
Vacant March 4, 1869 –
December 22, 1870
41st

Stephen A. Corker
(Waynesboro)
Democratic December 22, 1870 –
March 3, 1871
Elected after the disqualification of Charles H. Prince.
[data missing]

Dudley M. DuBose
(Washington)
Democratic March 4, 1871 –
March 3, 1873
42nd Elected in 1870.
[data missing]

James C. Freeman
(Griffin)
Republican March 4, 1873 –
March 3, 1875
43rd Elected in 1872.
[data missing]

Milton A. Candler
(Atlanta)
Democratic March 4, 1875 –
March 3, 1879
44th
45th
Elected in 1874.
Re-elected in 1876.
[data missing]

Nathaniel J. Hammond
(Atlanta)
Democratic March 4, 1879 –
March 3, 1887
46th
47th
48th
49th
Elected in 1878.
Re-elected in 1880.
Re-elected in 1882.
Re-elected in 1884.
[data missing]
John D. Stewart
(Griffin)
Democratic March 4, 1887 –
March 3, 1891
50th
51st
Elected in 1886.
Re-elected in 1888.
[data missing]

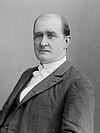
Leonidas F. Livingston
(Covington)
Democratic March 4, 1891 –
March 3, 1911
52nd
53rd
54th
55th
56th
57th
58th
59th
60th
61st
Elected in 1890.
Re-elected in 1892.
Re-elected in 1894.
Re-elected in 1896.
Re-elected in 1898.
Re-elected in 1900.
Re-elected in 1902.
Re-elected in 1904.
Re-elected in 1906.
Re-elected in 1908.
[data missing]

William S. Howard
(Kirkwood)
Democratic March 4, 1911 –
March 3, 1919
62nd
63rd
64th
65th
Elected in 1910.
Re-elected in 1912.
Re-elected in 1914.
Re-elected in 1916.
[data missing]

William David Upshaw
(Atlanta)
Democratic March 4, 1919 –
March 3, 1927
66th
67th
68th
69th
Elected in 1918.
Re-elected in 1920.
Re-elected in 1922.
Re-elected in 1924.
Lost renomination.
Leslie Jasper Steele
(Decatur)
Democratic March 4, 1927 –
July 24, 1929
70th
71st
Elected in 1926.
Re-elected in 1928.
Died.
Vacant July 14, 1929 –
October 2, 1929
71st

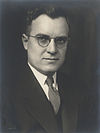
Robert Ramspeck
(Atlanta)
Democratic October 2, 1929 –
December 31, 1945
71st
72nd
73rd
74th
75th
76th
77th
78th
79th
Elected to finish Steele's term.
Re-elected in 1930.
Re-elected in 1932.
Re-elected in 1934.
Re-elected in 1936.
Re-elected in 1938.
Re-elected in 1940.
Re-elected in 1942.
Re-elected in 1944.
Resigned to return to working in the aviation industry.
Vacant December 31, 1945 –
February 12, 1946
79th

Helen Douglas Mankin
(Atlanta)
Democratic February 12, 1946 –
January 3, 1947
Elected to finish Ramspeck's term.
Lost renomination, and then lost re-election as a write-in candidate.

James C. Davis
(Stone Mountain)
Democratic January 3, 1947 –
January 3, 1963
80th
81st
82nd
83rd
84th
85th
86th
87th
Elected in 1946.
Re-elected in 1948.
Re-elected in 1950.
Re-elected in 1952.
Re-elected in 1954.
Re-elected in 1956.
Re-elected in 1958.
Re-elected in 1960.
Lost renomination.

Charles L. Weltner
(Atlanta)
Democratic January 3, 1963 –
January 3, 1967
88th
89th
Elected in 1962.
Re-elected in 1964.
Retired after refusing to endorse Lester Maddox for Governor of Georgia.

Fletcher Thompson
(East Point)
Republican January 3, 1967 –
January 3, 1973
90th
91st
92nd
Elected in 1966.
Re-elected in 1968.
Re-elected in 1970.
Retired to run for U.S. senator.

Andrew Young
(Atlanta)
Democratic January 3, 1973 –
January 29, 1977
93rd
94th
95th
Elected in 1972.
Re-elected in 1974.
Re-elected in 1976.
Resigned to become U.S. Ambassador to the United Nations.
Vacant January 29, 1977 –
April 6, 1977
95th

Wyche Fowler
(Atlanta)
Democratic April 6, 1977 –
January 3, 1987
95th
96th
97th
98th
99th
Elected to finish Young's term.
Re-elected in 1978.
Re-elected in 1980.
Re-elected in 1982.
Re-elected in 1984.
Retired to run for U.S. senator.

John Lewis
(Atlanta)
Democratic January 3, 1987 –
July 17, 2020
100th
101st
102nd
103rd
104th
105th
106th
107th
108th
109th
110th
111th
112th
113th
114th
115th
116th
Elected in 1986.
Re-elected in 1988.
Re-elected in 1990.
Re-elected in 1992.
Re-elected in 1994.
Re-elected in 1996.
Re-elected in 1998.
Re-elected in 2000.
Re-elected in 2002.
Re-elected in 2004.
Re-elected in 2006.
Re-elected in 2008.
Re-elected in 2010.
Re-elected in 2012.
Re-elected in 2014.
Re-elected in 2016.
Re-elected in 2018.
Died.
2003–2007
2007–2013
2013–2023
Vacant July 17, 2020 –
December 3, 2020
116th

Kwanza Hall
(Atlanta)
Democratic December 3, 2020 –
January 3, 2021
Elected to finish Lewis's term.
Was not a candidate for the next term.

Nikema Williams
(Atlanta)
Democratic January 3, 2021 –
present
117th
118th
119th
Elected in 2020.
Re-elected in 2022.
Re-elected in 2024.
2023–2025

Election results

Year Candidate Party Votes %
1844 (29th Congress) Green tickY John Henry Lumpkin Democratic 7,720 61.2
Miller Whig 4,889 38.8
1846 (30th Congress) Green tickY John Henry Lumpkin Democratic 5,349 79.4
Crook Whig 1,263 18.8
1848 (35th Congress) Green tickY Thomas C. Hackett Democratic 8,767 59.8
James M. Calhoun Whig 5,904 40.2
1851 (32nd Congress) Green tickY Elijah Webb Chastain Union 13,882 65.0
Stiles Whig 7,481 35.0
1853 (33rd Congress) Green tickY Elijah Webb Chastain Democratic 8,118 50.8
Tumlin Democratic 7,866 49.2
1855 (34th Congress) Green tickY John Henry Lumpkin Democratic 11,290 58.6
Tumlin   7,978 41.4
1857 (35th Congress) Green tickY Augustus R. Wright Democratic 9,669 63.0
Hooper Independent Democrat 5,690 37.1
1859 (36th Congress) Green tickY John Underwood Democratic 12,339 85.1
Shackleford Opp. 2,162 14.9
Georgia announced its secession from the Union, January 28, 1861.
April 20, 1868 (40th Congress)
Special election
Green tickY Charles H. Prince Republican    
Hilliard Democratic    
January 1871 (45th Congress)
Special election
Green tickY Stephen Alfestus Corker Democratic    
1870 (42nd Congress) Green tickY Dudley M. Du Bose Democratic 15,363 62.3
Isham S. Fannin Republican 9,302 37.7
1872 (43rd Congress) Green tickY James C. Freeman Republican 10,910 50.7
Glenn Liberal Republican 10,631 49.4
1874 (44th Congress) Green tickY Milton A. Candler Democratic 12,450 66.5
Mills Republican 6,273 33.5
1876 (45th Congress) Green tickY Milton A. Candler Democratic 18,083 67.5
Markham Republican 8,714 32.5
1878 (46th Congress) Green tickY Nathaniel Job Hammond Democratic 10,269 55.6
Arnold Greenback 8,196 44.4
1880 (47th Congress) Green tickY Nathaniel Job Hammond Democratic 11,947 62.6
Clark Republican 7,133 37.4
1882 (48th Congress) Green tickY Nathaniel Job Hammond Democratic 10,788 65.2
Buck Independent Republican 5,756 34.8
1884 (49th Congress) Green tickY Nathaniel Job Hammond Democratic 9,008 63.7
Martin Republican 5,130 36.3
1886 (50th Congress) Green tickY John D. Stewart Democratic 2,999 100.0
1888 (55th Congress) Green tickY John D. Stewart Democratic 10,971 68.6
George S. Thomas Republican 5,032 31.4
1890 (52nd Congress) Green tickY Leonidas F. Livingston Democratic 8,688 70.7
Will Haight Republican 3,608 29.3
1892 (53rd Congress) Green tickY Leonidas F. Livingston Democratic 9,732 60.2
Samuel Small Populist & Republican 6,447 39.9
1894 (54th Congress) Green tickY Leonidas F. Livingston Democratic 7,781 59.7
Robert Todd Populist 5,264 40.4
1896 (55th Congress) Green tickY Leonidas F. Livingston Democratic 9,258 58.0
J. C. Hendrix Republican 6,715 42.0
1898 (56th Congress) Green tickY Leonidas F. Livingston Democratic 3,027 97.6
1900 (57th Congress) Green tickY Leonidas F. Livingston Democratic 8,828 76.6
Charles I. Brannan Independent 2,685 23.3
1902 (58th Congress) Green tickY Leonidas F. Livingston Democratic 2,485 100.0
1904 (59th Congress) Green tickY Leonidas F. Livingston Democratic 9,387 71.4
C. P. Goree Republican 3,760 28.6
1906 (60th Congress) Green tickY Leonidas F. Livingston Democratic 3,030 100.0
1908 (65th Congress) Green tickY Leonidas F. Livingston Democratic 8,909 100.0
1910 (62nd Congress) Green tickY William Schley Howard Democratic 4,091 100.0
1912 (63rd Congress) Green tickY William Schley Howard Democratic 12,000 100.0
1914 (64th Congress) Green tickY William Schley Howard Democratic 4,780 88.2
Dewar Progressive 640 11.8
1916 (65th Congress) Green tickY William Schley Howard Democratic 13,174 88.8
Moore   1,656 11.2
1918 (66th Congress) Green tickY William D. Upshaw Democratic 5,251 100.0
1920 (67th Congress) Green tickY William D. Upshaw Democratic 10,649 70.1
John W. Martin Republican 4,544 29.9
1922 (68th Congress) Green tickY William D. Upshaw Democratic 4,646 93.1
Max H. Wilensky   347 7.0
1924 (69th Congress) Green tickY William D. Upshaw Democratic 16,608 100.0
1926 (70th Congress) Green tickY Leslie J. Steele Democratic 2,919 99.9
1928 (75th Congress) Green tickY Leslie J. Steele Democratic 19,328 100.0
October 2, 1929 (75th Congress)
Special election
Green tickY Robert Ramspeck Democratic    
1930 (72nd Congress) Green tickY Robert Ramspeck Democratic 10,752 100.0
1932 (73rd Congress) Green tickY Robert Ramspeck Democratic 26,657 100.0
1934 (74th Congress) Green tickY Robert Ramspeck Democratic 5,206 100.0
1936 (75th Congress) Green tickY Robert Ramspeck Democratic 35,540 89.4
H. H. Alexander Republican 4,213 10.6
1938 (76th Congress) Green tickY Robert Ramspeck Democratic 6,906 97.2
1940 (77th Congress) Green tickY Robert Ramspeck Democratic, Independent 41,677 99.9
1942 (78th Congress) Green tickY Robert Ramspeck Democratic 9,176 96.0
1944 (79th Congress) Green tickY Robert Ramspeck Democratic 50,257 94.5
H. H. Alexander Independent 2,929 5.5
February 12, 1946 (79th Congress)
Special election
Green tickY Helen Douglas Mankin Democratic    
1946 (80th Congress) Green tickY James C. Davis Democratic 31,444 61.6
Helen Douglas Mankin Independent (Write-in) 19,527 38.3
1948 (85th Congress) Green tickY James C. Davis Democratic 54,637 99.6
1950 (82nd Congress) Green tickY James C. Davis Democratic 49,317 100.0
1952 (83rd Congress) Green tickY James C. Davis Democratic 83,920 100.0
1954 (84th Congress) Green tickY James C. Davis Democratic 54,069 64.4
Charles A. Moye Jr. Republican 29,911 35.6
1956 (85th Congress) Green tickY James C. Davis Democratic 85,292 59.2
Randolph W. Thrower Republican 58,777 40.8
1958 (86th Congress) Green tickY James C. Davis Democratic 32,135 100.0
1960 (87th Congress) Green tickY James C. Davis Democratic 80,023 99.7
1962 (88th Congress) Green tickY Charles Weltner Democratic 60,583 55.6
L. J. O'Callaghan Republican 48,466 44.4
1964 (89th Congress) Green tickY Charles Weltner Democratic 65,803 54.0
L. J. O'Callaghan Republican 55,983 46.0
1966 (90th Congress) Green tickY Fletcher Thompson Republican 55,423 60.1
Archie Lindsey Democratic 36,751 39.9
1968 (95th Congress) Green tickY Fletcher Thompson Republican 79,258 55.6
Charles Weltner Democratic 63,183 44.4
1970 (92nd Congress) Green tickY Fletcher Thompson Republican 78,540 57.4
Andrew Young Democratic 58,394 42.6
1972 (93rd Congress) Green tickY Andrew Young Democratic 72,289 52.8
Rodney M. Cook Republican 64,495 47.1
1974 (94th Congress) Green tickY Andrew Young Democratic 69,221 71.6
Wyman C. Lowe Republican 27,397 28.3
1976 (95th Congress) Green tickY Andrew Young Democratic 96,056 66.7
Ed Gadrix Republican 47,998 33.3
1977 (95th Congress)
Special election
Wyche Fowler Democratic 29,898 39.6
John Lewis Democratic 21,531 28.6
Paul Coverdell Republican 16,509 21.9
April 5, 1977 (95th Congress)
Special runoff
Green tickY Wyche Fowler Democratic 54,378 62.4
John Lewis Democratic 32,732 37.6
1978 (96th Congress) Green tickY Wyche Fowler Democratic 52,739 75.5
Thomas P. Bowles Jr. Republican 17,132 24.5
1980 (97th Congress) Green tickY Wyche Fowler Democratic 101,646 74.0
F. William Dowda Republican 35,640 26.0
1982 (98th Congress) Green tickY Wyche Fowler Democratic 53,264 80.8
J.E. (Billy) McKinney Independent 9,047 13.7
Paul Jones Republican 3,633 5.5
1984 (99th Congress) Green tickY Wyche Fowler Democratic 151,233 100.0
1986 (100th Congress) Green tickY John Lewis Democratic 93,229 75.3
Portia A. Scott Republican 30,562 24.7
1988 (105th Congress) Green tickY John Lewis Democratic 135,194 78.2
J. W. Tibbs Jr. Republican 37.693 21.8
1990 (102nd Congress) Green tickY John Lewis Democratic 86,037 75.6
J. W. Tibbs Jr. Republican 27,781 24.4
1992 (103rd Congress) Green tickY John Lewis Democratic 147,445 72.1
Paul R. Stabler Republican 56,960 27.9
1994 (104th Congress) Green tickY John Lewis Democratic 85,094 69.1
Dale Dixon Republican 37,999 30.9
1996 (105th Congress) Green tickY John Lewis Democratic 136,555 100.0
1998 (106th Congress) Green tickY John Lewis Democratic 109,177 78.5
John H. Lewis Sr. Republican 29,877 21.5
2000 (107th Congress) Green tickY John Lewis Democratic 137,333 77.2
Hank Schwab Republican 40,606 22.8
2002 (108th Congress) Green tickY John Lewis Democratic 116,259 100.0
2004 (109th Congress) Green tickY John Lewis Democratic 201,773 100.0
2006 (110th Congress) Green tickY John Lewis Democratic 122,380 100.0
2008 (111th Congress) Green tickY John Lewis Democratic 122,345 100.0

2002

2002 Georgia's 5th congressional district election
Party Candidate Votes %
Democratic John Lewis (Incumbent) 116,230 100.00
Total votes 116,230 100.00
Turnout  
Democratic hold

2004

2004 Georgia's 5th congressional district election
Party Candidate Votes %
Democratic John Lewis (Incumbent) 201,773 100.00
Total votes 201,773 100.00
Turnout  
Democratic hold

2006

2006 Georgia's 5th congressional district election
Party Candidate Votes %
Democratic John Lewis (Incumbent) 122,380 99.95
No party Others 64 0.05
Total votes 122,444 100.00
Turnout  
Democratic hold

2008

2008 Georgia's 5th congressional district election
Party Candidate Votes %
Democratic John Lewis (Incumbent) 231,368 99.95
No party Others 106 0.05
Total votes 231,437 100.00
Turnout  
Democratic hold

2010

2010 Georgia's 5th congressional district election
Party Candidate Votes %
Democratic John Lewis (Incumbent) 130,782 73.72
Republican Fenn Little 46,622 26.28
Total votes 177,404 100.00
Turnout  
Democratic hold

2012

2012 Georgia's 5th congressional district election
Party Candidate Votes %
Democratic John Lewis (Incumbent) 234,330 84.39
Republican Howard Stopeck 43,335 15.61
Total votes 277,665 100.00
Turnout  
Democratic hold

2014

2014 Georgia's 5th congressional district election
Party Candidate Votes %
Democratic John Lewis (Incumbent) 170,326 100
Total votes 170,326 100.00
Turnout  
Democratic hold

2016

2016 Georgia's 5th congressional district election
Party Candidate Votes %
Democratic John Lewis (Incumbent) 253,781 84.44
Republican Douglas Bell 46,768 15.56
Total votes 300,549 100.00
Turnout  
Democratic hold

2018

2018 Georgia's 5th congressional district election
Party Candidate Votes %
Democratic John Lewis (Incumbent) 273,084 100
Total votes 273,084 100.00
Turnout  
Democratic hold


2020 special election

Main article: 2020 Georgia's 5th congressional district special election
2020 Georgia's 5th congressional district special election, September 29, 2020
Party Candidate Votes %
Democratic Kwanza Hall 11,104 31.75%
Democratic Robert Michael Franklin Jr. 9,987 28.55%
Democratic Mable Thomas 6,692 19.13%
Democratic Keisha Waites 4,255 12.17%
Democratic Barrington Martin II 1,944 5.56%
Libertarian Chase Oliver 712 2.04%
Independent Steven Muhammad 282 0.8%
Total votes 34,967 100.00%
2020 Georgia's 5th congressional district special election runoff, December 1, 2020
Party Candidate Votes %
Democratic Kwanza Hall 13,450 54.27%
Democratic Robert Michael Franklin Jr. 11,332 45.73%
Total votes 24,782 100.00%
Democratic hold

2020

2020 Georgia's 5th congressional district election
Party Candidate Votes %
Democratic Nikema Williams 301,857 85.02
Republican Angela Stanton-King 52,646 14.08
Total votes 354,503 100.00
Democratic hold

2022

2022 Georgia's 5th congressional district election
Party Candidate Votes %
Democratic Nikema Williams (incumbent) 243,687 82.48
Republican Christian Zimm 51,769 17.52
Total votes 295,456 100.00
Democratic hold

See also

References

  1. "Congressional Districts Relationship Files (state-based)". www.census.gov. US Census Bureau Geography.
  2. "My Congressional District". www.census.gov. Center for New Media & Promotion (CNMP), US Census Bureau.
  3. "My Congressional District". www.census.gov. Center for New Media & Promotion (CNMP), US Census Bureau.
  4. ^ "2022 Cook PVI: District Map and List". Cook Political Report. July 12, 2022. Retrieved January 10, 2023.
  5. Justice Department approves Georgia's political maps Archived January 7, 2012, at the Wayback Machine. Atlanta Journal-Constitution. Last accessed December 27, 2011
  6. 2012 Congressional maps - Metro Atlanta, Georgia Legislature. Last accessed January 1, 2012
  7. Prince was seated despite the fact that Georgia had not yet been readmitted to the Union. On the opening of the 45th United States Congress in March 1869, he claimed that his election of 1868 entitled him to sit in that Congress, but this claim was rejected by Congress.
  8. "Results Summary". Georgia Secretary of State. Retrieved September 30, 2020.
  9. "Results Summary". Georgia Secretary of State. Retrieved December 14, 2020.

External links

Georgia's congressional districts
All districts
At-large
1st
2nd
3rd
4th
5th
6th
7th
8th
9th
10th
11th
12th
13th
14th
  • The at-large district is obsolete.
See also
Georgia's past and present representatives, senators, and delegations

33°42′25″N 84°24′04″W / 33.70694°N 84.40111°W / 33.70694; -84.40111

Categories: