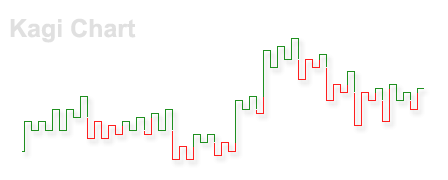
The Kagi chart (Japanese: かぎ足, romanized: kagiashi) is a chart used for tracking price movements and to make decisions on purchasing stock. It differs from traditional stock charts such as the Candlestick chart by being mostly independent of time. This feature aids in producing a chart that reduces random noise.
Due to its effectiveness in showing a clear path of price movements, the Kagi chart is one of the various charts that investors use to make better decisions about stocks. The most important benefit of this chart is that it is independent of time and change of direction occurs only when a specific amount is reached. Kagi chart signals are best used in conjunction with other forms of analysis.
The Kagi chart was originally developed in Japan during the 1870s when the Japanese stock market started trading. It was used for tracking the price movement of rice and found use in determining the general levels of supply and demand for certain assets.
Construction
Kagi charts look similar to swing charts and do not have a time axis. A Kagi chart is created with a series of vertical lines connected by short horizontal lines. The thickness and direction of the lines is based on the price of the underlying stock or asset, as follows:
- The thickness/color of the line changes when the price reaches the high or low of the previous vertical line.
- The direction of the line changes when the price reaches a preset reversal amount, which is usually set at 4%. When a direction change occurs, a short horizontal line is drawn between the lines of opposite direction.
Alternatively, thin and thick lines can be replaced with lines of different colours.
Changes in line thickness are used to generate transaction signals. Buy signals are generated when the Kagi line goes from thin to thick and sell signals are generated when the line turns from thick to thin.
The basic algorithm used is:
- Find the starting point. The starting point is generally considered the first closing price. From this point forward, you compare each day's closing price with the starting price.
- Draw a thin vertical line from the starting price to each day's closing price, while the trend does not reverse.
- If a day's closing price moves in the opposite direction to the trend by more than the reversal amount, draw a short horizontal line and a new vertical line, beginning from the horizontal line to the new closing price.
- If the price on a day is greater than or equal to the previous high, change to a thick line and continue the vertical line. If the price on that day is less than or equal to the previous low, then change to a thin line.
References
- Kagi Chart, Investopedia. Retrieved 16 Oct 2008.
- A Look At Kagi Charts, Investopedia. Retrieved 16 Oct 2008.
Further reading
- Nison, Steve, Beyond Candlesticks: New Japanese Charting Techniques Revealed, ISBN 978-0471007203
| Technical analysis | |||||||||||||||
|---|---|---|---|---|---|---|---|---|---|---|---|---|---|---|---|
| Concepts | |||||||||||||||
| Charts | |||||||||||||||
| Patterns |
| ||||||||||||||
| Indicators |
| ||||||||||||||
| Analysts | |||||||||||||||