Misplaced Pages

Legde/Quitzöbel

Article snapshot taken from Wikipedia with creative commons attribution-sharealike license. Give it a read and then ask your questions in the chat. We can research this topic together.
Municipality in Brandenburg, Germany
Legde/Quitzöbel
Municipality
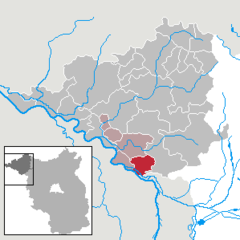
Location of Legde/Quitzöbel within Prignitz district
LenzerwischeLenzen (Elbe)LanzCumlosenGroß PankowPritzwalkGumtowPlattenburgLegde/QuitzöbelRühstädtBad WilsnackBreeseWeisenWittenbergePerlebergKarstädtGülitz-ReetzPirowBergePutlitzKümmernitztalGerdshagenHalenbeck-RohlsdorfMeyenburgMarienfließTriglitzOstprignitz-RuppinPutlitzMecklenburg-VorpommernSaxony-AnhaltSaxony-Anhalt
Legde/Quitzöbel is located in GermanyLegde/QuitzöbelLegde/Quitzöbel Show map of GermanyLegde/Quitzöbel is located in BrandenburgLegde/QuitzöbelLegde/Quitzöbel Show map of Brandenburg
Coordinates: 52°55′00″N 11°58′00″E / 52.91667°N 11.96667°E / 52.91667; 11.96667
CountryGermany
StateBrandenburg
DistrictPrignitz
Municipal assoc.Bad Wilsnack/Weisen
Government
 • Mayor (2024–29) Marius Will
Area
 • Total41.42 km (15.99 sq mi)
Elevation24 m (79 ft)
Population
 • Total591
 • Density14/km (37/sq mi)
Time zoneUTC+01:00 (CET)
 • Summer (DST)UTC+02:00 (CEST)
Postal codes19336
Dialling codes038791
Vehicle registrationPR
Websitewww.amt-badwilsnack-weisen.de

Legde/Quitzöbel is a municipality in the Prignitz district, in Brandenburg, Germany.

Demography

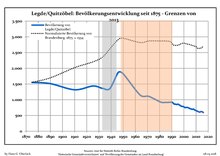
Development of Population since 1875 within the Current Boundaries (Blue Line: Population; Dotted Line: Comparison to Population Development of Brandenburg state; Grey Background: Time of Nazi rule; Red Background: Time of Communist rule)
Legde/Quitzöbel: Population development
within the current boundaries (2013)
YearPop.±% p.a.
1875 1,554—    
1890 1,513−0.18%
1910 1,318−0.69%
1925 1,438+0.58%
1933 1,362−0.68%
1939 1,357−0.06%
1946 1,873+4.71%
1950 1,825−0.65%
1964 1,149−3.25%
1971 1,109−0.50%
1981 925−1.80%
1985 917−0.22%
1989 921+0.11%
1990 926+0.54%
1991 900−2.81%
1992 864−4.00%
1993 860−0.46%
1994 849−1.28%
1995 859+1.18%
1996 844−1.75%
YearPop.±% p.a.
1997 815−3.44%
1998 794−2.58%
1999 788−0.76%
2000 775−1.65%
2001 751−3.10%
2002 756+0.67%
2003 754−0.26%
2004 738−2.12%
2005 721−2.30%
2006 706−2.08%
2007 697−1.27%
2008 702+0.72%
2009 672−4.27%
2010 656−2.38%
2011 634−3.35%
2012 623−1.74%
2013 606−2.73%
2014 625+3.14%
2015 619−0.96%
2016 595−3.88%

References

  1. Landkreis Prignitz Wahl der Bürgermeisterin / des Bürgermeisters. Retrieved 10 July 2024.
  2. "Bevölkerungsentwicklung und Bevölkerungsstandim Land Brandenburg Dezember 2022" (PDF). Amt für Statistik Berlin-Brandenburg (in German). June 2023.
  3. Detailed data sources are to be found in the Wikimedia Commons.Population Projection Brandenburg at Wikimedia Commons
Towns and municipalities in Prignitz
Coat of Arms of Prignitz district
Stub icon

This Brandenburg location article is a stub. You can help Misplaced Pages by expanding it.

Categories: