| New Hampshire's 1st congressional district | |
|---|---|
 Interactive map of district boundaries since January 3, 2023 Interactive map of district boundaries since January 3, 2023 | |
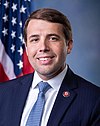
| Representative | Chris Pappas D–Manchester |
| Distribution |
|
| Population (2023 ) | 697,780 |
| Median household income | $98,681 |
| Ethnicity |
|
| Cook PVI | EVEN |
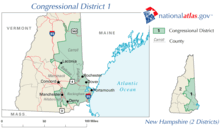
New Hampshire's 1st congressional district covers parts of Southern New Hampshire and the eastern portion of the state. The district contains parts of Hillsborough, Rockingham, Merrimack, Grafton, and Belknap counties; and the entirety of Strafford and Carroll counties.
The district contains Manchester, New Hampshire's most populous city, and its immediate suburbs. Most of the district's population resides in Rockingham County, which includes much of the Seacoast Region. The northern part of the district in Belknap, Carroll, and Grafton counties are far more rural.
The district is home to the University of New Hampshire, the state's largest university. Some of the largest employers in the district are Fidelity Investments, J. Jill, Elliot Health System, and The University System of New Hampshire. It is represented in the United States House of Representatives by Democrat Chris Pappas.
The district is one of seven with a Cook Partisan Voting Index of EVEN, meaning that the district votes almost identically to the national electorate. It was also identified as a presidential bellwether district by Sabato's Crystal Ball, having voted for the Electoral College winner in the past four presidential elections as of 2020.
History
This district is competitive, with a Cook Partisan Voting Index of EVEN. During the mid-2000s and the 2010s, the district was extremely competitive, having changed hands in five of the last eight elections, with an incumbent losing reelection each time. The streak was broken in 2020 when incumbent Democrat Chris Pappas won reelection; he later won reelection again in 2022, becoming the first representative elected to a third consecutive term in the district since John E. Sununu. The district was a presidential bellwhether starting in 2000, voting for the winner by narrow margins each time until 2024, when Kamala Harris narrowly carried the district.
Composition
As of the 2021 redistricting cycle, the 1st district contains 74 municipalities.
Belknap County (9)
Carroll County (15)
- Bartlett, Brookfield, Chatham, Conway, Eaton, Effingham, Freedom, Hart's Location, Madison, Moultonborough, Ossipee, Tamworth, Tuftonboro, Wakefield, Wolfeboro
Merrimack County (1)
Rockingham County (32)
- Auburn, Brentwood, Candia, Chester, Danville, Derry, East Kingston, Epping, Exeter, Fremont, Greenland, Hampstead, Hampton, Hampton Falls, Kensington, Kingston, Londonderry, New Castle, Newfields, Newington, Newmarket, Newton, North Hampton, Nottingham, Plaistow, Portsmouth, Raymond, Rye, Sandown, Seabrook, South Hampton, Stratham
Strafford County (13)
- All 13 municipalities
Election results from statewide races
Election results from presidential races:
| Year | Office | Results |
|---|---|---|
| 2000 | President | George W. Bush 49% – Al Gore 46% |
| 2004 | President | George W. Bush 51% – John Kerry 48% |
| 2008 | President | Barack Obama 52.8% – John McCain 46.4% |
| 2012 | President | Barack Obama 50.8% – Mitt Romney 49.1% |
| 2016 | President | Donald Trump 47.5% – Hillary Clinton 45.9% |
| 2020 | President | Joe Biden 52.2% – Donald Trump 46.2% |
| 2024 | President | Kamala Harris 50.3% – Donald Trump 48.3% |
Election results from statewide races:
| Year | Office | Results |
|---|---|---|
| 2012 | Governor | Maggie Hassan 53% – Ovide Lamontagne 44% |
| 2014 | Governor | Maggie Hassan 51% – Walt Havenstein 49% |
| Senate | Scott Brown 51% – Jeanne Shaheen 49% | |
| 2016 | Governor | Chris Sununu 50% – Colin Van Ostern 45% |
| Senate | Kelly Ayotte 49% – Maggie Hassan 47% | |
| 2018 | Governor | Chris Sununu 55% – Molly Kelly 44% |
| 2020 | Governor | Chris Sununu 67% – Dan Feltes 32% |
| Senate | Jeanne Shaheen 56% – Corky Messner 42% | |
| 2022 | Governor | Chris Sununu 58% – Tom Sherman 40% |
| Senate | Maggie Hassan 53% – Don Bolduc 45% |
List of members representing the district
Electoral history
2012
| Party | Candidate | Votes | % | |
|---|---|---|---|---|
| Democratic | Carol Shea-Porter | 171,650 | 49.7 | |
| Republican | Frank Guinta (incumbent) | 158,659 | 46.0 | |
| Libertarian | Brendan Kelly | 14,521 | 4.2 | |
| n/a | Write-ins | 192 | 0.1 | |
| Total votes | 345,022 | 100.0 | ||
| Democratic gain from Republican | ||||
2014
| Party | Candidate | Votes | % | |
|---|---|---|---|---|
| Republican | Frank Guinta | 125,508 | 51.7 | |
| Democratic | Carol Shea-Porter (incumbent) | 116,769 | 48.1 | |
| n/a | Write-ins | 459 | 0.2 | |
| Total votes | 242,736 | 100.0 | ||
| Republican gain from Democratic | ||||
2016
| Party | Candidate | Votes | % | |
|---|---|---|---|---|
| Democratic | Carol Shea-Porter | 162,080 | 44.3 | |
| Republican | Frank Guinta (incumbent) | 157,176 | 42.9 | |
| Independent | Shawn O' Connor | 34,735 | 9.5 | |
| Independent | Brendan Kelly | 6,074 | 1.7 | |
| Libertarian | Robert Lombardo | 5,507 | 1.5 | |
| n/a | Write-ins | 412 | 0.1 | |
| Total votes | 365,984 | 100.0 | ||
| Democratic gain from Republican | ||||
2018
| Party | Candidate | Votes | % | |
|---|---|---|---|---|
| Democratic | Chris Pappas | 155,884 | 53.6 | |
| Republican | Eddie Edwards | 130,996 | 45.0 | |
| Libertarian | Dan Belforti | 4,048 | 1.4 | |
| n/a | Write-ins | 111 | 0.0 | |
| Total votes | 291,039 | 100.0 | ||
| Democratic hold | ||||
2020
| Party | Candidate | Votes | % | |
|---|---|---|---|---|
| Democratic | Chris Pappas (incumbent) | 205,606 | 51.32 | |
| Republican | Matt Mowers | 185,159 | 46.21 | |
| Libertarian | Zachary Dumont | 9,747 | 2.43 | |
| N/A | Scatter | 149 | 0.04 | |
| Total votes | 400,661 | 100.0 | ||
| Democratic hold | ||||
2022
| Party | Candidate | Votes | % | |
|---|---|---|---|---|
| Democratic | Chris Pappas (incumbent) | 167,391 | 54.00 | |
| Republican | Karoline Leavitt | 142,229 | 45.89 | |
| Write-in | 342 | 0.11 | ||
| Total votes | 309,962 | 100.0 | ||
| Democratic hold | ||||
2024
| Party | Candidate | Votes | % | |
|---|---|---|---|---|
| Democratic | Chris Pappas (incumbent) | 218,577 | 54.00 | |
| Republican | Russell Prescott | 185,936 | 45.93 | |
| Write-in | 295 | 0.07 | ||
| Total votes | 404,808 | 100.0 | ||
| Democratic hold | ||||
Historical district boundaries

See also
Notes
- The previous senator Norris Cotton resigned after election and governor Meldrim Thomson appointed him to the vacant term. Wyman lost the special election.
References
- Martis, Kenneth C. (1989). The Historical Atlas of Political Parties in the United States Congress. New York: Macmillan Publishing Company.
- Martis, Kenneth C. (1982). The Historical Atlas of United States Congressional Districts. New York: Macmillan Publishing Company.
- Congressional Biographical Directory of the United States 1774–present
- ^ "My Congressional District: Congressional District 1 (118th Congress), New Hampshire". United States Census Bureau.
- "2022 Cook PVI: District Map and List".
- "Employers.jsp". www2.nhes.nh.gov. Retrieved April 18, 2021.
- "Districts of Change, Part Two: Looking Beyond the Straight-Party Districts".
- "Just 47 House districts flipped in the last three presidential elections. What do they tell us?".
- ^ "NH-SOS - NHSOS". sos.nh.gov. Retrieved October 30, 2020.
- "State of New Hampshire General Election Congressional District 1 2012". New Hampshire Secretary of State Elections Division. November 6, 2013. Retrieved April 7, 2013.
- Scatterings votes are listed as they were reported to the Clerk of the United States House of Representatives
- "Representative in Congress - 2014 General Election". NH Secretary of State. November 4, 2014. Retrieved November 16, 2014.
- "2016 General Election Information and Results". New Hampshire Secretary of State Elections Division. November 8, 2016. Retrieved November 30, 2016.
- Johnson, Cheryl L. (February 28, 2019). "Statistics of the Congressional Election of November 6, 2018". Clerk of the U.S. House of Representatives. Retrieved April 27, 2019.
- Gardner, William M. (November 19, 2020). "2020 General Election Results". New Hampshire Department of State. Retrieved November 22, 2020.
- "2022 General Election Results". New Hampshire Department of State.
| New Hampshire's congressional districts | |
|---|---|
|
| New Hampshire's current delegation to the United States Congress | |
|---|---|
| Senators |
|
| Representatives (ordered by district) |
|
43°27′28″N 71°11′57″W / 43.45778°N 71.19917°W / 43.45778; -71.19917
Categories: