| |||||||||||||||||||||||||||||||||||||||||||||||||||||||||||||||
All 150 seats in the Australian House of Representatives 76 seats needed for a majority | |||||||||||||||||||||||||||||||||||||||||||||||||||||||||||||||
| Turnout | 93.2% | ||||||||||||||||||||||||||||||||||||||||||||||||||||||||||||||
|---|---|---|---|---|---|---|---|---|---|---|---|---|---|---|---|---|---|---|---|---|---|---|---|---|---|---|---|---|---|---|---|---|---|---|---|---|---|---|---|---|---|---|---|---|---|---|---|---|---|---|---|---|---|---|---|---|---|---|---|---|---|---|---|
| |||||||||||||||||||||||||||||||||||||||||||||||||||||||||||||||
2010 Australian federal election |
|---|
| National results |
| State and territory results |
|
|
The following tables show state-by-state results in the Australian House of Representatives at the 2010 federal election, Labor 72, Coalition 72, Nationals (WA) 1, Australian Greens 1, with 4 independents.
Australia
| Party | Votes | % | Swing | Seats | Change | ||
|---|---|---|---|---|---|---|---|
| Liberal | 3,777,383 | 30.46 | +0.76 | 44 | |||
| Liberal National Party (QLD) | 1,130,525 | 9.12 | +0.60 | 21 | |||
| National | 419,286 | 3.43 | −0.04 | 6 | |||
| Country Liberal (NT) | 38,335 | 0.31 | −0.01 | 1 | |||
| Coalition | 5,365,529 | 43.32 | +1.31 | 72 | |||
| Australian Labor Party | 4,711,363 | 37.99 | −5.40 | 72 | |||
| Australian Greens | 1,458,998 | 11.76 | +3.97 | 1 | |||
| Independents | 312,496 | 2.52 | +0.30 | 4 | |||
| Family First Party | 279,330 | 2.25 | +0.26 | ||||
| Christian Democratic Party | 83,009 | 0.67 | −0.17 | ||||
| National (WA) | 43,101 | 0.34 | +0.20 | 1 | |||
| One Nation | 27,184 | 0.22 | −0.04 | ||||
| Liberal Democratic Party | 24,262 | 0.20 | +0.06 | ||||
| Australian Democrats | 22,376 | 0.18 | −0.54 | ||||
| Secular Party of Australia | 12,752 | 0.10 | +0.10 | ||||
| Australian Sex Party | 11,263 | 0.09 | +0.09 | ||||
| Socialist Equality Party | 11,160 | 0.09 | +0.06 | ||||
| Socialist Alliance | 9,348 | 0.08 | +0.01 | ||||
| Citizens Electoral Council | 8,017 | 0.06 | −0.16 | ||||
| Democratic Labor Party | 5,212 | 0.04 | −0.01 | ||||
| The Climate Sceptics | 4,339 | 0.03 | +0.03 | ||||
| Australia First Party | 3,670 | 0.03 | +0.03 | ||||
| Non-Custodial Parents Party | 2,835 | 0.02 | +0.01 | ||||
| Building Australia Party | 1,497 | 0.01 | +0.01 | ||||
| Carers Alliance | 1,458 | 0.01 | +0.01 | ||||
| Communist Alliance | 656 | 0.01 | +0.01 | ||||
| Others | 2,508 | 0.02 | +0.01 | ||||
| Total | 12,402,363 | 150 | |||||
| Two-party-preferred vote | |||||||
| Australian Labor Party | 6,216,445 | 50.12 | −2.58 | 72 | |||
| Liberal/National Coalition | 6,185,918 | 49.88 | +2.58 | 72 | |||
| Invalid/blank votes | 729,304 | 5.55 | +1.60 | ||||
| Registered voters/turnout | 14,086,869 | 93.22 | |||||
| Source: Commonwealth Election 2010 | |||||||
- Preference flows
- Greens − Labor 78.8% (-0.9) to Coalition 21.2% (+0.9)
- Family First − Coalition 59.8% (-0.5) to Labor 40.2% (+0.5)
- Christian Democrats − Coalition 73.5% (+3.9) to Labor 26.5% (-3.9)
- Nationals WA − Coalition 75.9% (-5.1) to Labor 24.1% (+5.1)
- Independent candidates − Coalition 56.5% (+1.9) to Labor 43.5% (-1.9)
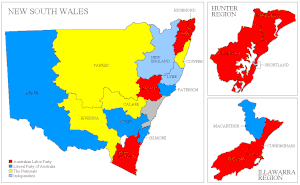
New South Wales


| Party | Votes | % | Swing | Seats | Change | ||
|---|---|---|---|---|---|---|---|
| Liberal | 1,470,146 | 36.67 | +4.04 | 16 | |||
| National | 317,867 | 7.93 | +0.02 | 4 | |||
| Coalition | 1,788,013 | 44.60 | +4.06 | 20 | |||
| Australian Labor Party | 1,494,490 | 37.28 | −6.86 | 26 | |||
| Australian Greens | 410,405 | 10.24 | +2.35 | ||||
| Independents | 172,921 | 4.31 | +1.00 | 2 | |||
| Christian Democratic Party | 54,544 | 1.36 | −0.56 | ||||
| One Nation | 19,182 | 0.48 | +0.27 | ||||
| Family First Party | 17,453 | 0.44 | −0.43 | ||||
| Australian Democrats | 11,409 | 0.28 | +0.01 | ||||
| Socialist Equality Party | 9,106 | 0.23 | +0.15 | ||||
| Liberal Democratic Party | 8,928 | 0.22 | +0.10 | ||||
| Secular Party of Australia | 3,529 | 0.09 | +0.09 | ||||
| Socialist Alliance | 3,484 | 0.09 | +0.03 | ||||
| Australia First Party | 3,375 | 0.08 | +0.08 | ||||
| Australian Sex Party | 3,180 | 0.08 | +0.08 | ||||
| Non-Custodial Parents Party | 2,835 | 0.07 | +0.05 | ||||
| Building Australia Party | 1,497 | 0.04 | +0.04 | ||||
| Carers Alliance | 1,458 | 0.04 | +0.04 | ||||
| Citizens Electoral Council | 1,187 | 0.03 | −0.19 | ||||
| Communist Alliance | 656 | 0.02 | +0.02 | ||||
| The Climate Sceptics | 275 | 0.01 | +0.01 | ||||
| Others | 1,391 | 0.03 | +0.01 | ||||
| Total | 4,009,318 | 48 | |||||
| Two-party-preferred vote | |||||||
| Australian Labor Party | 1,958,077 | 48.84 | –4.84 | 26 | |||
| Liberal/National Coalition | 2,051,241 | 51.16 | +4.84 | 20 | |||
| Invalid/blank votes | 293,763 | 6.83 | +1.88 | ||||
| Registered voters/turnout | 4,610,795 | 93.33 | |||||
| Source: Commonwealth Election 2010 | |||||||
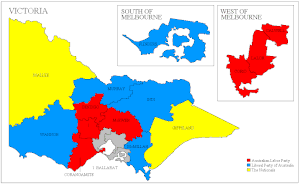
Victoria


| Party | Votes | % | Swing | Seats | Change | ||
|---|---|---|---|---|---|---|---|
| Australian Labor Party | 1,361,416 | 42.81 | –1.88 | 22 | |||
| Liberal | 1,159,301 | 36.45 | –1.64 | 12 | |||
| National | 101,419 | 3.19 | +0.17 | 2 | |||
| Coalition | 1,260,720 | 39.64 | –1.47 | 14 | |||
| Australian Greens | 402,482 | 12.66 | +4.49 | 1 | |||
| Family First Party | 99,747 | 3.14 | +0.12 | ||||
| Independents | 26,525 | 0.83 | −0.17 | ||||
| Liberal Democratic Party | 7,839 | 0.25 | +0.15 | ||||
| Australian Sex Party | 6,023 | 0.19 | +0.19 | ||||
| Secular Party of Australia | 5,239 | 0.16 | +0.16 | ||||
| Australian Democrats | 3,947 | 0.12 | −1.10 | ||||
| Socialist Alliance | 2,225 | 0.07 | +0.00 | ||||
| Socialist Equality Party | 1,656 | 0.05 | +0.03 | ||||
| Citizens Electoral Council | 922 | 0.03 | −0.24 | ||||
| Christian Democratic Party | 632 | 0.02 | −0.02 | ||||
| Australia First Party | 295 | 0.01 | +0.01 | ||||
| Others | 516 | 0.02 | +0.00 | ||||
| Total | 3,180,184 | 37 | |||||
| Two-party-preferred vote | |||||||
| Australian Labor Party | 1,758,982 | 55.31 | +1.04 | 22 | |||
| Liberal/National Coalition | 1,421,202 | 44.69 | –1.04 | 14 | |||
| Invalid/blank votes | 149,699 | 4.50 | +1.25 | ||||
| Registered voters/turnout | 3,561,873 | 93.49 | |||||
| Source: Commonwealth Election 2010 | |||||||
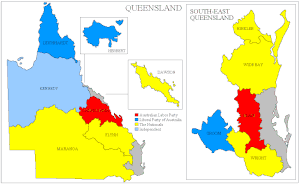
Queensland


| Party | Votes | % | Swing | Seats | Change | |
|---|---|---|---|---|---|---|
| Liberal National Party | 1,130,525 | 47.42 | +2.95 | 21 | ||
| Australian Labor Party | 800,712 | 33.58 | –9.33 | 8 | ||
| Australian Greens | 260,471 | 10.92 | +5.29 | |||
| Family First Party | 92,794 | 3.89 | +1.62 | |||
| Independents | 83,310 | 3.49 | +0.50 | 1 | ||
| Liberal Democratic Party | 4,662 | 0.20 | +0.05 | |||
| Democratic Labor Party | 4,590 | 0.19 | +0.19 | |||
| One Nation | 3,921 | 0.16 | −0.20 | |||
| Citizens Electoral Council | 1,462 | 0.06 | −0.09 | |||
| Socialist Alliance | 717 | 0.03 | −0.02 | |||
| Secular Party of Australia | 414 | 0.02 | +0.02 | |||
| Others | 601 | 0.03 | +0.03 | |||
| Total | 2,384,179 | 30 | ||||
| Two-party-preferred vote | ||||||
| Liberal National Party | 1,314,675 | 55.14 | +5.58 | 21 | ||
| Australian Labor Party | 1,069,504 | 44.86 | –5.58 | 8 | ||
| Invalid/blank votes | 137,395 | 5.45 | +1.89 | |||
| Registered voters/turnout | 2,719,360 | 92.73 | ||||
| Source: Commonwealth Election 2010 | ||||||
| Electoral results for the divisions of the Australian House of Representatives in Queensland | |
|---|---|
| |
Western Australia

| Party | Votes | % | Swing | Seats | Change | |
|---|---|---|---|---|---|---|
| Liberal | 566,145 | 47.02 | +0.71 | 11 | ||
| Labor | 375,381 | 31.18 | –5.62 | 3 | ||
| Greens | 158,117 | 13.13 | +4.20 | |||
| National | 43,101 | 3.58 | +2.44 | 1 | ||
| Christian Democrats | 27,833 | 2.31 | +0.20 | |||
| Family First | 20,698 | 1.72 | +0.51 | |||
| Independents | 5,079 | 0.42 | –1.27 | |||
| Sex Party | 2,060 | 0.17 | +0.17 | |||
| One Nation | 1,471 | 0.12 | −1.03 | |||
| Socialist Alliance | 1,280 | 0.11 | +0.01 | |||
| Citizens Electoral Council | 1,277 | 0.11 | −0.15 | |||
| Democratic Labour | 622 | 0.05 | +0.05 | |||
| Climate Sceptics | 539 | 0.04 | +0.04 | |||
| Socialist Equality | 398 | 0.03 | +0.02 | |||
| Total | 1,204,001 | 15 | ||||
| Two-party-preferred vote | ||||||
| Liberal | 679,140 | 56.41 | +3.15 | 11 | ||
| Labor | 524,861 | 43.59 | –3.15 | 3 | ||
| Invalid/blank votes | 60,967 | 4.82 | +0.97 | |||
| Registered voters/turnout | 1,362,534 | 92.84 | ||||
| Source: Commonwealth Election 2010 | ||||||
| Electoral results for the divisions of the Australian House of Representatives in Western Australia | |
|---|---|
| |
South Australia

| Party | Votes | % | Swing | Seats | Change | |
|---|---|---|---|---|---|---|
| Australian Labor Party | 399,279 | 40.74 | –2.44 | 6 | ||
| Liberal | 394,003 | 40.21 | –1.55 | 5 | ||
| Australian Greens | 117,364 | 11.98 | +5.03 | |||
| Family First Party | 48,638 | 4.96 | +0.91 | |||
| Australian Democrats | 7,020 | 0.72 | −0.79 | |||
| Independents | 5,086 | 0.52 | –0.18 | |||
| The Climate Sceptics | 3,525 | 0.36 | +0.36 | |||
| Liberal Democratic Party | 2,833 | 0.29 | +0.12 | |||
| One Nation | 1,105 | 0.11 | −0.06 | |||
| Socialist Alliance | 786 | 0.08 | +0.08 | |||
| Secular Party of Australia | 310 | 0.03 | +0.03 | |||
| Total | 979,949 | 11 | ||||
| Two-party-preferred vote | ||||||
| Australian Labor Party | 521,115 | 53.18 | +0.78 | 6 | ||
| Liberal | 458,834 | 46.82 | –0.78 | 5 | ||
| Invalid/blank votes | 56,565 | 5.46 | +1.68 | |||
| Registered voters/turnout | 1,104,698 | 93.83 | ||||
| Source: Commonwealth Election 2010 | ||||||
| Electoral results for the divisions of the Australian House of Representatives in South Australia | |
|---|---|
Tasmania

| Party | Votes | % | Swing | Seats | Change | |
|---|---|---|---|---|---|---|
| Australian Labor Party | 143,796 | 43.95 | +1.18 | 4 | ||
| Liberal | 109,908 | 33.60 | –4.62 | 0 | ||
| Australian Greens | 55,042 | 16.82 | +3.32 | |||
| Independents | 15,627 | 4.78 | +2.56 | 1 | ||
| Secular Party of Australia | 1,085 | 0.33 | +0.33 | |||
| Socialist Alliance | 856 | 0.26 | +0.00 | |||
| Citizens Electoral Council | 838 | 0.26 | −0.31 | |||
| Total | 327,152 | 5 | ||||
| Two-party-preferred vote | ||||||
| Australian Labor Party | 198,332 | 60.62 | +4.41 | 4 | ||
| Liberal | 128,830 | 39.38 | –4.41 | 0 | ||
| Invalid/blank votes | 13,791 | 4.04 | +1.12 | |||
| Registered voters/turnout | 358,609 | 95.07 | ||||
| Source: Commonwealth Election 2010 | ||||||
| Electoral results for the divisions of the Australian House of Representatives in Tasmania | |
|---|---|
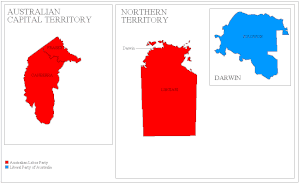
Territories

Australian Capital Territory
| Party | Votes | % | Swing | Seats | Change | |
|---|---|---|---|---|---|---|
| Australian Labor Party | 100,700 | 45.02 | –6.08 | 2 | ||
| Liberal | 77,880 | 34.81 | +1.58 | 0 | ||
| Australian Greens | 42,942 | 19.20 | +6.04 | |||
| Secular Party of Australia | 2,175 | 0.97 | +0.97 | |||
| Total | 223,697 | 2 | ||||
| Two-party-preferred vote | ||||||
| Australian Labor Party | 137,948 | 61.67 | –1.73 | 2 | ||
| Liberal | 85,749 | 38.33 | +1.73 | 0 | ||
| Invalid/blank votes | 10,926 | 4.66 | +2.35 | |||
| Registered voters/turnout | 247,941 | 94.63 | ||||
| Source: Commonwealth Election 2010 | ||||||
Northern Territory
| Party | Votes | % | Swing | Seats | Change | |
|---|---|---|---|---|---|---|
| Country Liberal Party | 38,335 | 40.83 | –0.20 | 1 | ||
| Australian Labor Party | 35,589 | 37.91 | –9.74 | 1 | ||
| Australian Greens | 12,175 | 12.97 | +4.92 | |||
| Independents | 3,948 | 4.21 | +1.55 | |||
| Citizens Electoral Council | 2,331 | 2.48 | +2.23 | |||
| One Nation | 1,505 | 1.60 | +1.60 | |||
| Total | 93,883 | 2 | ||||
| Two-party-preferred vote | ||||||
| Australian Labor Party | 47,636 | 50.74 | –4.67 | 1 | ||
| Country Liberal Party | 46,247 | 49.26 | +4.67 | 1 | ||
| Invalid/blank votes | 6,198 | 6.19 | +2.34 | |||
| Registered voters/turnout | 121,059 | 82.67 | ||||
| Source: Commonwealth Election 2010 | ||||||
| Electoral results for the divisions of the Australian House of Representatives of the Australian Capital and Northern Territories | |
|---|---|
| |
See also
- 2010 Australian federal election
- Results of the 2010 Australian federal election (Senate)
- Post-election pendulum for the 2010 Australian federal election
- Members of the Australian House of Representatives, 2010–2013
Notes
- The Liberal National Party was an amalgamation of the Liberal Party and National Party in Queensland. Change is compared to the coalition total in 2007.
- ^ The independents were Bob Katter (Kennedy, Qld), Rob Oakeshott (Lyne, NSW), Andrew Wilkie (Denison, Tas) and Tony Windsor (New England, NSW).
- ^ The National Party of Western Australia prior to and subsequent to the election were not in the federal Coalition agreement. Nationals WA MP Tony Crook stated that he was a crossbencher, and has said: "In every news report and press report we see, my number is being allocated in with the Coalition and it shouldn't be". Thus, the party has been counted separately from the Coalition totals.
- The abolished district was Lowe (Labor).
- The new seat was Wright.
References
- State by state breakdowns: AEC
- State by state primary vote: AEC Archived 2010-08-23 at the Wayback Machine
- State by state 2PP: AEC Archived 2010-09-23 at the Wayback Machine
- Barber, Stephen (15 August 2011). "Commonwealth Election 2010" (PDF). Research Paper 2 2011–12. Parliamentary Library. ISSN 1834-9854.
- 2010 nationwide 2PP preference flows and 2007 flows: AEC
- Ker, Peter (26 August 2010). "Don't count me among Coalition, says Nat". The Age. Fairfax Media. Retrieved 27 August 2010.
External links
- Two-party swing by seat: Psephos
- Historical two-party state-by-state results (1949 to present): Australian Electoral Commission
- Psephos (Dr Adam Carr) archive page for the electoral geography of the 2010 Australian election
| (2007 ←) 2010 Australian federal election (→ 2013) | |
|---|---|
| Incumbent Prime Minister: Julia Gillard (Labor) | |
| House of Representatives | |||
|---|---|---|---|
| Senate | |||
| By-elections | |||

