| New York's 2nd congressional district | |
|---|---|
 Interactive map of district boundaries since January 3, 2025 Interactive map of district boundaries since January 3, 2025 | |
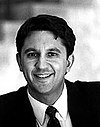
| Representative | Andrew Garbarino R–Bayport |
| Distribution |
|
| Population (2023) | 777,290 |
| Median household income | $118,189 |
| Ethnicity |
|
| Cook PVI | R+3 |
New York's 2nd congressional district is a congressional district for the United States House of Representatives along the South Shore of Long Island, New York. It includes southwestern Suffolk County and a small portion of southeastern Nassau County. The district is currently represented by Republican Andrew Garbarino.
From 2003 to 2013 it included all of the town of Huntington and parts of the towns of Babylon, Islip and Smithtown in Suffolk County as well as part of the town of Oyster Bay in Nassau County. It comprised such communities as Bay Shore, Brentwood, Central Islip, Commack, Deer Park, Dix Hills, Huntington, Melville, North Amityville, Northport, Oakdale, Plainview, Ronkonkoma, Sayville and Wyandanch. Much of this area is now the 3rd congressional district, while most of the territory currently in the 2nd district was located in the 3rd district.
According to the APM Research Lab's Voter Profile Tools (featuring the U.S. Census Bureau's 2019 American Community Survey), the district contained about 512,000 potential voters (citizens, age 18+). Of these, 68% are White, 17% Latino, and 10% Black. Immigrants make up 15% of the district's potential voters. The median income among households (with one or more potential voter) in the district is about $109,400. As for the educational attainment of potential voters in the district, 32% hold a bachelor's or higher degree.
Composition
Nassau County communities in the 2nd district include Oyster Bay and East Massapequa. Suffolk County communities include Amityville, Babylon, Lindenhurst, Captree, Deer Park, East Farmingdale, Gilgo, North Amityville, North Babylon, North Lindenhurst, Oak Beach, West Babylon, Wheatley Heights, Wyandanch, Copiague Harbor, Brightwaters, Islandia, Ocean Beach, Saltaire, Bay Shore, Bayport, Baywood, Bohemia, Brentwood, Central Islip, East Islip, Great River, Hauppauge, Holbrook, Holtsville, Islip, Islip Terrace, Kismet, Lake Ronkonkoma, Lonelyville, North Bay Shore, North Great River, Oakdale, Ronkonkoma, Sayville, West Bay Shore, West Islip, West Sayville, Dunewood, Fair Harbor, Blue Point, Patchogue, East Patchogue, North Patchogue, Medford, Hagerman, North Bellport, Bellport, Brookhaven, South Haven, Shirley, Mastic, Mastic Beach, Moriches, East Moriches, Center Moriches, Manorville, Eastport, Davis Park, Water Island, Fire Island Pines, Cherry Grove, Point O'Woods, and Ocean Bay Park.
Recent statewide election results
| Election results in the US from presidential races | ||
|---|---|---|
| Year | Office | Results |
| 1992 | President | Bush 40–40% |
| 1996 | President | Clinton 54–34% |
| 2000 | President | Gore 57–39% |
| 2004 | President | Kerry 53–45% |
| 2008 | President | Obama 51–48% |
| 2012 | President | Obama 52–47% |
| 2016 | President | Trump 53–44% |
| 2020 | President | Trump 51–47% |
List of members representing the district
1789–1805: one seat
| Representative | Party | Years | Cong ress |
Electoral history | |
|---|---|---|---|---|---|
| District established March 4, 1789 | |||||
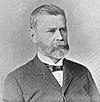
 John Laurance (New York) |
Pro-Administration | March 4, 1789 – March 3, 1793 |
1st 2nd |
Elected in 1789. Re-elected in 1790. Retired. | |
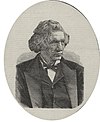
 John Watts (New York) |
Pro-Administration | March 4, 1793 – March 3, 1795 |
3rd | Elected in 1793. Lost re-election. | |
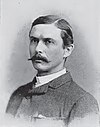
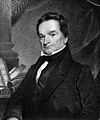 Edward Livingston (New York) |
Democratic- Republican |
March 4, 1795 – March 3, 1801 |
4th 5th 6th |
Elected in 1794. Re-elected in 1796. Re-elected in 1798. [data missing] | |
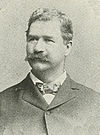
 Samuel L. Mitchill (New York) |
Democratic- Republican |
March 4, 1801 – March 3, 1803 |
7th | Elected in 1800. Redistricted to the 3rd district. | |
 Joshua Sands (Brooklyn) |
Federalist | March 4, 1803 – March 3, 1805 |
8th | Elected in 1802. Retired. | |
1805–1809: two seats on general ticket with 3rd district
Gurdon S. Mumford is usually listed as member from the 2nd district, and George Clinton Jr. from the 3rd district, because Clinton was elected to fill the vacancy caused by the election of Mitchill to the U.S. Senate, and Mitchill had been elected previously in the 3rd district. However, in 1804 Mitchill was already re-elected on the 2nd/3rd general ticket, and both Clinton and Mumford were elected in special elections, receiving votes in both districts.
| Cong ress |
Years | Seat A | Seat B | ||||||
|---|---|---|---|---|---|---|---|---|---|
| Representative | Party | Electoral history | Representative | Party | Electoral history | ||||
| 9th 10th |
March 4, 1805 – March 3, 1809 |
Gurdon S. Mumford (New York) |
Democratic- Republican |
Daniel D. Tompkins was elected in 1804 but declined the seat when appointed to the New York Supreme Court. Elected to begin Tompkins's term. Re-elected in 1806. |
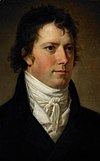 George Clinton Jr. (New York) |
Democratic- Republican |
Samuel L. Mitchill (previously of the 3rd district) was re-elected in 1804 but resigned November 22, 1804 when elected U.S. Senator. Elected to begin Mitchell's term. Re-elected in 1806. The districts were separated again, and a second seat was added to the 2nd district. | ||
The districts were separated in 1809.
1809–1823: two seats
From 1809 to 1823, two seats were apportioned to the second district, elected at-large on a general ticket.
1823–present: one seat
Recent election results
New York election law allows for fusion voting, where a candidate can run as a member of multiple parties. The pooled vote totals for candidates are listed first, and the split of the votes among the parties they ran as is listed beneath. See below for blank, void, and scattering notes.*
| Year | Democrat | Votes | Pct | Republican | Votes | Pct | 3rd Party | Party | Votes | Pct | ||||||||||
|---|---|---|---|---|---|---|---|---|---|---|---|---|---|---|---|---|---|---|---|---|
| 2000 | 90,438 | 48% | Joan B. Johnson | 65,880 | 35% | Robert Walsh | Right to Life | 11,224 | 6% | |||||||||||
| Democratic | 90,438 | Republican | 65,880 | Richard N. Thompson | Conservative | 10,824 | 6% | |||||||||||||
| David A. Bishop | 10,266 | 5% | ||||||||||||||||||
| Independence | 7,595 | |||||||||||||||||||
| Green | 1,404 | |||||||||||||||||||
| Working Families | 1,267 | |||||||||||||||||||
| 2002 | 85,451 | 58% | Joseph P. Finley | 59,117 | 40% | John Keenan | Green | 1,558 | 1% | |||||||||||
| Democratic | 75,845 | Republican | 48,239 | |||||||||||||||||
| Independence | 7,632 | Conservative | 5,772 | |||||||||||||||||
| Working Families | 1,974 | Right to Life | 5,106 | |||||||||||||||||
| 2004 | 161,593 | 67% | Richard Hoffmann | 80,950 | 33% | |||||||||||||||
| Democratic | 147,197 | Republican | 72,953 | |||||||||||||||||
| Independence | 9,508 | Conservative | 7,997 | |||||||||||||||||
| Working Families | 4,888 | |||||||||||||||||||
| 2006 | 105,276 | 70% | John W. Bugler | 44,212 | 30% | |||||||||||||||
| Democratic | 94,100 | Republican | 37,671 | |||||||||||||||||
| Independence | 7,443 | Conservative | 6,541 | |||||||||||||||||
| Working Families | 3,733 | |||||||||||||||||||
| 2008 | 161,279 | 67% | Frank J. Stalzer | 79,641 | 33% | |||||||||||||||
| Democratic | 143,759 | Republican | 70,145 | |||||||||||||||||
| Independence | 11,900 | Conservative | 9,496 | |||||||||||||||||
| Working Families | 5,620 | |||||||||||||||||||
| 2010 | 94,694 | 56% | John Gomez | 72,115 | 43% | Anthony Tolda | CST | 1,258 | 1% | |||||||||||
| Democratic | 84,211 | Republican | 53,747 | |||||||||||||||||
| Independence | 6,353 | Conservative | 13,525 | |||||||||||||||||
| Working Families | 4,130 | |||||||||||||||||||
| 2012 | Vivianne Falcone | 92,060 | 41% | 131,091 | 59% | |||||||||||||||
| 2014 | Patricia Maher | 40,009 | 28% | 91,701 | 65% | |||||||||||||||
| 2016 | Du Wayne Gregory | 110,938 | 38% | 181,506 | 62% | |||||||||||||||
| 2018 | Liuba Grechen Shirley | 106,996 | 45% | 122,103 | 53% | |||||||||||||||
| Democratic | 102,977 | Republican | 107,495 | |||||||||||||||||
| Women's Equality | 1,371 | Conservative | 11,742 | |||||||||||||||||
| Working Families | 2,648 | Independence | 2,417 | |||||||||||||||||
| 2020 | Jackie Gordon | 154,123 | 46% | 177,353 | 53% | Harry Burger | Green | 3,446 | 1% |
| ||||||||||
* Blank, void, and write-in candidate ("scattering") notes: In 2000, there were 37,596 BVS votes; in 2002, 14,087; in 2004, 40,937; and in 2006, 14,101. Since 2008, results were separated out, and there were 54,163 blank votes; 10 void ballots; and 12 votes cast for write-in candidates. In 2010, 7,104 were blank votes; 93 were void ballots; and thirty were votes cast for write-in candidates.
See also
- List of United States congressional districts
- New York's congressional districts
- United States congressional delegations from New York
Notes
- "New York congressional districts by urban and rural population and land area". United States Census Bureau. June 8, 2017. Archived from the original on November 21, 2019. Retrieved October 5, 2023.
- "My Congressional District".
- "2022 Cook PVI: District Map and List". The Cook Political Report. July 12, 2022. Retrieved January 10, 2023.
- Parsons, Stanley B.; Dubin, Michael J.; Parsons, Karen Toombs (1990). United States Congressional Districts, 1883-1913. Bloomsbury Academic. p. 89. ISBN 9780313264825.
- Parsons, Stanley B.; Dubin, Michael J.; Parsons, Karen Toombs (1990). United States Congressional Districts, 1883-1913. Bloomsbury Academic. p. 247. ISBN 9780313264825.
- Parsons, Stanley B.; Dubin, Michael J.; Parsons, Karen Toombs (1990). United States Congressional Districts, 1883-1913. Bloomsbury Academic. p. 382. ISBN 9780313264825.
- "Election Statistics". Office of the Clerk of the House of Representatives. Retrieved January 10, 2008.
- New York State Board of Elections 2008 Election Results page
- New York State Board of Elections 2010 Election Results page
References
- Martis, Kenneth C. (1989). The Historical Atlas of Political Parties in the United States Congress. New York: Macmillan Publishing Company.
- Martis, Kenneth C. (1982). The Historical Atlas of United States Congressional Districts. New York: Macmillan Publishing Company.
- Congressional Biographical Directory of the United States 1774–present
- National atlas congressional maps
| New York's congressional districts | |
|---|---|
|
