Main article: 2004 United States presidential election
| ||||||||||||||||||||||||||
| Turnout | 68.4% (of registered voters) 55.1% (of voting age population) | |||||||||||||||||||||||||
|---|---|---|---|---|---|---|---|---|---|---|---|---|---|---|---|---|---|---|---|---|---|---|---|---|---|---|
| ||||||||||||||||||||||||||
 County Results County Results
| ||||||||||||||||||||||||||
| ||||||||||||||||||||||||||
The 2004 United States presidential election in New Mexico took place on November 2, 2004, and was part of the 2004 United States presidential election. Voters chose five representatives, or electors to the Electoral College, who voted for president and vice president.
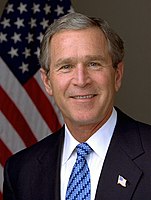
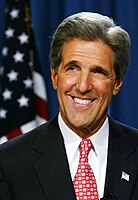
New Mexico was won by incumbent Republican President George W. Bush by a 0.79% margin of victory. Bush took 49.84% of the vote, narrowly defeating Democratic Senator of Massachusetts John Kerry, who took 49.05%. Prior to the election, most news organizations considered it as a swing state. New Mexico is a very diverse state, with 42% of the state Hispanic and another 42% of the electorate non-Hispanic white. Exit polling showed that incumbent George W. Bush performed better among Hispanic Americans in 2004 than in 2000. This may be one of the reasons why Bush won and swung the state from 2000, when Al Gore had narrowly won the state. New Mexico was one of the only three states which switched sides between 2000 and 2004 (Iowa also flipped from Gore to Bush, while New Hampshire flipped from Bush to Kerry).
As of the 2024 presidential election, this is the last time that the Republican nominee carried New Mexico and the last time the Republican won Los Alamos County and Sandoval County.
Caucuses
Campaign
Predictions
There were 12 news organizations who made state-by-state predictions of the election. Here are their last predictions before election day.
| Source | Ranking |
|---|---|
| D.C. Political Report | Lean D |
| Associated Press | Toss-up |
| CNN | Lean R (flip) |
| Cook Political Report | Toss-up |
| Newsweek | Toss-up |
| New York Times | Toss-up |
| Rasmussen Reports | Toss-up |
| Research 2000 | Lean D |
| Washington Post | Toss-up |
| Washington Times | Toss-up |
| Zogby International | Likely D |
| Washington Dispatch | Likely R (flip) |
Polling
Polls showed Kerry in the lead for most of the general election. However, Bush caught up in the last month. The last 3 polling average showed Bush leading with 48% to 46%, which meant that the undecided voters would decide the election.
Fundraising
Bush raised $869,407. Kerry raised $1,289,134.
Advertising and visits
Because of the closeness of the prior election, New Mexico was largely considered as a swing state. Over the general election, Bush visited the state 5 times and Kerry visited 8 times. Nearly $2 million were spent by both campaigns combined in television advertisements each week.
Analysis
Although Bill Richardson, the Democratic governor, was very popular, the state, which voted for Al Gore by 300 votes in 2000, chose George W. Bush in 2004, by 6,000 votes. The only county Bush won in 2004 that he didn't win in 2000 was Colfax County. Half of the population in New Mexico is Hispanic, and Bush was able to appeal to over 40% of the Hispanic vote.
Results
| Party | Candidate | Votes | % | ±% | |
|---|---|---|---|---|---|
| Republican |
|
376,930 | 49.84% | +1.99 | |
| Democratic | 370,942 | 49.05% | +1.14 | ||
| Independent | 4,053 | 0.54% | −3.01 | ||
| Libertarian | 2,382 | 0.31% | −0.03 | ||
| Green | 1,226 | 0.16% | −3.39 | ||
| Constitution | 771 | 0.10% | +0.04 | ||
| Total votes | 756,304 | 100.00% | |||
| Republican win | |||||
By county
| County | George W. Bush Republican |
John Kerry Democratic |
Various candidates Other parties |
Margin | Total votes cast | ||||
|---|---|---|---|---|---|---|---|---|---|
| # | % | # | % | # | % | # | % | ||
| Bernalillo | 121,454 | 47.29% | 132,252 | 51.50% | 3,105 | 1.21% | -10,798 | -4.21% | 256,811 |
| Catron | 1,427 | 71.60% | 551 | 27.65% | 15 | 0.75% | 876 | 43.95% | 1,993 |
| Chaves | 14,773 | 68.06% | 6,726 | 30.99% | 206 | 0.95% | 8,047 | 37.07% | 21,705 |
| Cibola | 3,477 | 46.44% | 3,913 | 52.26% | 97 | 1.29% | -436 | -5.82% | 7,487 |
| Colfax | 3,082 | 51.64% | 2,824 | 47.32% | 62 | 1.04% | 258 | 4.32% | 5,968 |
| Curry | 10,649 | 74.54% | 3,541 | 24.79% | 96 | 0.67% | 7,108 | 49.75% | 14,286 |
| De Baca | 706 | 71.10% | 281 | 28.30% | 6 | 0.60% | 425 | 42.80% | 993 |
| Dona Ana | 29,548 | 47.69% | 31,762 | 51.26% | 650 | 1.05% | -2,214 | -3.57% | 61,960 |
| Eddy | 13,268 | 65.46% | 6,880 | 33.94% | 122 | 0.61% | 6,388 | 31.52% | 20,270 |
| Grant | 6,135 | 45.81% | 7,095 | 52.98% | 162 | 1.20% | -960 | -7.17% | 13,392 |
| Guadalupe | 914 | 40.32% | 1,340 | 59.11% | 13 | 0.58% | -426 | -18.79% | 2,267 |
| Harding | 380 | 59.01% | 259 | 40.22% | 5 | 0.78% | 121 | 18.79% | 644 |
| Hidalgo | 1,081 | 55.04% | 861 | 43.84% | 22 | 1.11% | 220 | 11.20% | 1,964 |
| Lea | 14,430 | 79.37% | 3,646 | 20.05% | 105 | 0.58% | 10,784 | 59.32% | 18,181 |
| Lincoln | 6,070 | 67.34% | 2,822 | 31.31% | 122 | 1.36% | 3,248 | 36.03% | 9,014 |
| Los Alamos | 5,810 | 51.89% | 5,206 | 46.49% | 181 | 1.61% | 604 | 5.40% | 11,197 |
| Luna | 4,164 | 54.84% | 3,340 | 43.99% | 89 | 1.17% | 824 | 10.85% | 7,593 |
| McKinley | 7,351 | 35.64% | 13,051 | 63.28% | 221 | 1.07% | -5,700 | -27.64% | 20,623 |
| Mora | 928 | 32.84% | 1,876 | 66.38% | 22 | 0.78% | -948 | -33.54% | 2,826 |
| Otero | 14,066 | 67.74% | 6,433 | 30.98% | 265 | 1.28% | 7,633 | 36.76% | 20,754 |
| Quay | 2,661 | 64.63% | 1,422 | 34.54% | 34 | 0.83% | 1,239 | 30.09% | 4,117 |
| Rio Arriba | 5,149 | 34.33% | 9,753 | 65.02% | 97 | 0.65% | -4,604 | -30.69% | 14,999 |
| Roosevelt | 4,997 | 69.95% | 2,082 | 29.14% | 65 | 0.91% | 2,915 | 40.81% | 7,144 |
| San Juan | 29,525 | 65.60% | 14,843 | 32.98% | 638 | 1.42% | 14,682 | 32.62% | 45,006 |
| San Miguel | 3,313 | 27.34% | 8,683 | 71.67% | 120 | 0.99% | -5,370 | -44.33% | 12,116 |
| Sandoval | 22,628 | 50.80% | 21,421 | 48.09% | 492 | 1.11% | 1,207 | 2.71% | 44,541 |
| Santa Fe | 18,466 | 27.89% | 47,074 | 71.11% | 660 | 1.00% | -28,608 | -43.22% | 66,200 |
| Sierra | 3,162 | 61.31% | 1,926 | 37.35% | 69 | 1.33% | 1,236 | 23.96% | 5,157 |
| Socorro | 3,696 | 47.08% | 4,025 | 51.27% | 130 | 1.66% | -329 | -4.19% | 7,851 |
| Taos | 3,666 | 24.71% | 10,987 | 74.06% | 182 | 1.22% | -7,321 | -49.35% | 14,835 |
| Torrance | 4,026 | 61.87% | 2,386 | 36.67% | 95 | 1.46% | 1,640 | 25.20% | 6,507 |
| Union | 1,454 | 77.30% | 411 | 21.85% | 16 | 0.85% | 1,043 | 55.45% | 1,881 |
| Valencia | 14,474 | 55.64% | 11,270 | 43.33% | 268 | 1.03% | 3,204 | 12.31% | 26,012 |
| Total | 376,930 | 49.84% | 370,942 | 49.05% | 8,432 | 1.11% | 5,988 | 0.79% | 756,304 |
Counties that flipped from Democratic to Republican
By congressional district
Kerry won 2 of 3 congressional districts including one district won by a Republican.
| District | Bush | Kerry | Representative |
|---|---|---|---|
| 1st | 48% | 51% | Heather Wilson |
| 2nd | 58% | 41% | Steve Pearce |
| 3rd | 45% | 54% | Tom Udall |
Electors
Main article: List of 2004 United States presidential electorsNew Mexico voters cast their ballots for electors: representatives to the Electoral College. New Mexico has 5 electors because it has 3 congressional districts and 2 senators. All candidates who appear on the ballot or qualify to receive write-in votes must submit a list of 5 electors, who pledge to vote for their candidate and his or her running mate. Whoever wins the majority of votes in the state is awarded all 5 electoral votes. Their chosen electors then vote for president and vice president. Although electors are pledged to their candidate and running mate, they are not obligated to vote for them. An elector who votes for someone other than his or her candidate is known as a faithless elector.
The electors of each state and the District of Columbia met on December 13, 2004, to cast their votes for president and vice president. The Electoral College itself never meets as one body. Instead the electors from each state and the District of Columbia meet in their respective capitols.
The following were the members of the Electoral College from the state. All were pledged to and voted for Bush/Cheney.
- Rod Adair
- Ruth Kelly
- Rick Lopez
- Lou Melvin
- Rodney Montoya
References
- Members DC Political Report
- "2004 Presidential Election Polls. New Mexico Polls". US Election Atlas.
- "George W Bush - $374,659,453 raised, '04 election cycle, Republican Party, President".
- "John F Kerry - $345,826,176 raised, '04 election cycle, Democrat Party, President".
- "America votes 2004: SHOWDOWN STATES: NEW MEXICO". CNN. Retrieved May 27, 2022.
- "America votes 2004: Campaign ad buys". CNN. Archived from the original on April 22, 2021. Retrieved May 27, 2022.
- "Presidential Results by Congressional District, 2000-2008 – Swing State Project".
- "Presidential Candidates 2004". Archived from the original on December 1, 2005. Retrieved October 10, 2009.
External links
| State and district results of the 2004 United States presidential election | ||
|---|---|---|
|  | |
| (← 2000) 2004 United States presidential election (2008 →) | |||||||||||||||||||||||
|---|---|---|---|---|---|---|---|---|---|---|---|---|---|---|---|---|---|---|---|---|---|---|---|
| Republican Party |
| ||||||||||||||||||||||
| Democratic Party |
| ||||||||||||||||||||||
| Controversies | |||||||||||||||||||||||
| |||||||||||||||||||||||


