This is an old revision of this page, as edited by Dennis Bratland talk | contribs ) at 23:54, 7 August 2017 (Reverted 1 edit by 68.200.171.66 (talk ) to last revision by 67.44.193.106. (TW )). The present address (URL) is a permanent link to this revision, which may differ significantly from the current revision .
Revision as of 23:54, 7 August 2017 by Dennis Bratland talk | contribs ) (Reverted 1 edit by 68.200.171.66 (talk ) to last revision by 67.44.193.106. (TW ))(diff ) ← Previous revision | Latest revision (diff ) | Newer revision → (diff )
Main article: United States presidential election, 2016
United States presidential election in Montana, 2016
← 2012
November 8, 2016 2020 →
Turnout 74.44%
Trump
40-50%
50-60%
60-70%
70-80%
80-90%
>90%
Clinton
40-50%
50-60%
60-70%
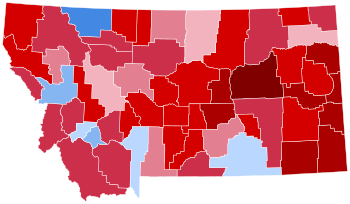
Treemap of the popular vote by county. The 2016 United States presidential election in Montana was won by Republican Donald Trump and running mate Mike Pence , on November 8, 2016, with 56.6% of the vote, as part of the 2016 general election . Democratic Party nominee Hillary Clinton and Tim Kaine received 33.2% of the vote. Montana assigns all of its three Electoral votes to the winner of the state's popular vote.
The Montana primary was on June 7, 2016, selecting nominees for the two major parties, as well as the Libertarian Party . Registered members of each party may only vote in their party's primary, while voters who are unaffiliated may choose any one primary in which to vote.
Trump's margin was 23.4 percentage points, exceeding Mitt Romney 13.7 point lead in 2012, and John McCain 2.4 points in 2008. Republicans have won Montana in every presidential election since 1996 . Libertarian nominee and third-party candidate Gary Johnson received 5.6% of the vote.
Primary Elections
Democratic primary
Main article: Montana Democratic primary, 2016
Four candidates appeared on the Democratic presidential primary ballot:
Montana Democratic primary, June 7, 2016
Candidate
Popular vote
Estimated delegates
Count
Percentage
Pledged
Unpledged
Total
Bernie Sanders
65,156
51.56%
11
1
12
Hillary Clinton
55,805
44.16%
10
5
15
No preference
5,415
4.28%
0
0
0
Uncommitted
—
0
0
0
Total
126,376
100%
21
6
27
Source:
Republican primary
Twelve candidates appeared on the Republican presidential primary ballot:
Montana Republican primary, June 7, 2016
Candidate
Votes
Percentage
Actual delegate count
Bound
Unbound
Total
Donald Trump
115,594
73.68%
27
0
27
Ted Cruz (withdrawn)
14,682
9.36%
0
0
0
John Kasich (withdrawn)
10,777
6.87%
0
0
0
No preference
7,369
4.70%
0
0
0
Marco Rubio (withdrawn)
5,192
3.31%
0
0
0
Jeb Bush (withdrawn)
3,274
2.09%
0
0
0
Unprojected delegates:
0
0
0
Total:
156,888
100.00%
27
0
27
Source: The Green Papers
Results
Results by county
Preliminary general election results for President as of 14 December 2016 by county.
County
Candidate
Trump
Clinton
Johnson
Stein
De La Fuente
Total
Beaverhead
percent
69.15%
23.57%
5.47%
1.44%
0.37%
100.00%
votes
3,353
1,143
265
70
18
4,849
Big Horn
percent
43.87%
49.57%
4.38%
1.68%
0.50%
100.00%
votes
1,853
2,094
185
71
21
4,224
Blaine
percent
47.47%
45.00%
3.82%
2.73%
0.97%
100.00%
votes
1,268
1,202
102
73
26
2,671
Broadwater
percent
74.97%
18.30%
5.40%
1.18%
0.16%
100.00%
votes
2,348
573
169
37
5
3,132
Carbon
percent
62.81%
30.64%
5.14%
1.17%
0.23%
100.00%
votes
3,748
1,828
307
70
14
5,967
Carter
percent
87.03%
8.99%
3.08%
0.77%
0.13%
100.00%
votes
678
70
24
6
1
779
Cascade
percent
57.10%
35.41%
5.81%
1.30%
0.39%
100.00%
votes
19,632
12,175
1,996
446
135
34,384
Chouteau
percent
64.85%
28.27%
5.06%
1.43%
0.39%
100.00%
votes
1,679
732
131
37
10
2,589
Custer
percent
70.53%
22.68%
5.82%
0.68%
0.29%
100.00%
votes
3,657
1,176
302
35
15
5,185
Daniels
percent
76.44%
17.59%
5.34%
0.63%
0.00%
100.00%
votes
730
168
51
6
0
955
Dawson
percent
76.66%
18.17%
4.25%
0.76%
0.16%
100.00%
votes
3,320
787
184
33
7
4,331
Deer Lodge
percent
42.04%
49.07%
6.58%
1.76%
0.55%
100.00%
votes
1,763
2,058
276
74
23
4,194
Fallon
percent
86.19%
10.38%
3.03%
0.27%
0.13%
100.00%
votes
1,279
154
45
4
2
1,484
Fergus
percent
73.10%
20.58%
5.17%
0.89%
0.26%
100.00%
votes
4,269
1,202
302
52
15
5,840
Flathead
percent
65.04%
28.59%
4.73%
1.41%
0.23%
100.00%
votes
30,240
13,293
2,199
656
106
46,494
Gallatin
percent
44.66%
45.50%
7.53%
1.99%
0.32%
100.00%
votes
23,802
24,246
4,015
1,061
168
53,292
Garfield
percent
91.20%
4.75%
3.77%
0.14%
0.14%
100.00%
votes
653
34
27
1
1
716
Glacier
percent
32.01%
61.67%
4.01%
1.88%
0.43%
100.00%
votes
1,620
3,121
203
95
22
5,061
Golden Valley
percent
77.49%
15.07%
6.16%
0.64%
0.64%
100.00%
votes
365
71
29
3
3
471
Granite
percent
67.15%
26.59%
4.68%
1.41%
0.17%
100.00%
votes
1,192
472
83
25
3
1,775
Hill
percent
54.12%
36.90%
6.82%
1.84%
0.33%
100.00%
votes
3,478
2,371
438
118
21
6,426
Jefferson
percent
62.64%
29.96%
5.91%
1.12%
0.36%
100.00%
votes
4,177
1,998
394
75
24
6,668
Judith Basin
percent
72.61%
19.57%
6.58%
1.00%
0.25%
100.00%
votes
872
235
79
12
3
1,201
Lake
percent
57.44%
36.43%
4.07%
1.75%
0.31%
100.00%
votes
7,530
4,776
534
229
41
13,110
Lewis and Clark
percent
49.34%
42.28%
6.45%
1.63%
0.30%
100.00%
votes
16,895
14,478
2,210
559
103
34,245
Liberty
percent
73.01%
21.55%
4.92%
0.21%
0.31%
100.00%
votes
698
206
47
2
3
956
Lincoln
percent
72.48%
21.98%
4.27%
1.03%
0.24%
100.00%
votes
6,729
2,041
396
96
22
9,284
Madison
percent
69.51%
24.88%
4.11%
1.22%
0.27%
100.00%
votes
3,297
1,180
195
58
13
4,743
McCone
percent
81.32%
14.53%
3.49%
0.66%
0.00%
100.00%
votes
862
154
37
7
0
1,060
Meagher
percent
74.77%
19.79%
4.21%
1.03%
0.21%
100.00%
votes
729
193
41
10
2
975
Mineral
percent
66.40%
25.91%
5.39%
1.75%
0.55%
100.00%
votes
1,330
519
108
35
11
2,003
Missoula
percent
37.70%
53.44%
5.69%
2.89%
0.29%
100.00%
votes
22,250
31,543
3,357
1,704
172
59,026
Musselshell
percent
81.42%
13.74%
3.89%
0.75%
0.21%
100.00%
votes
1,967
332
94
18
5
2,416
Park
percent
53.51%
38.63%
5.37%
2.15%
0.33%
100.00%
votes
4,980
3,595
500
200
31
9,306
Petroleum
percent
86.34%
9.32%
3.73%
0.31%
0.31%
100.00%
votes
278
30
12
1
1
322
Phillips
percent
79.73%
14.72%
4.58%
0.88%
0.09%
100.00%
votes
1,723
318
99
19
2
2,161
Pondera
percent
66.24%
27.17%
4.97%
1.25%
0.37%
100.00%
votes
1,799
738
135
34
10
2,716
Powder River
percent
84.11%
12.08%
3.71%
0.10%
0.00%
100.00%
votes
884
127
39
1
0
1,051
Powell
percent
72.62%
19.72%
5.83%
1.47%
0.36%
100.00%
votes
2,029
551
163
41
10
2,794
Prairie
percent
80.70%
14.51%
4.35%
0.15%
0.29%
100.00%
votes
556
100
30
1
2
689
Ravalli
percent
66.28%
27.85%
4.44%
1.17%
0.27%
100.00%
votes
14,810
6,223
992
261
60
22,346
Richland
percent
80.63%
13.84%
4.93%
0.47%
0.12%
100.00%
votes
3,908
671
239
23
6
4,847
Roosevelt
percent
49.26%
42.76%
4.93%
2.60%
0.44%
100.00%
votes
1,797
1,560
180
95
16
3,648
Rosebud
percent
65.49%
28.69%
4.42%
0.96%
0.44%
100.00%
votes
2,253
987
152
33
15
3,440
Sanders
percent
72.52%
20.61%
5.06%
1.59%
0.22%
100.00%
votes
4,286
1,218
299
94
13
5,910
Sheridan
percent
67.74%
26.04%
5.02%
1.09%
0.11%
100.00%
votes
1,241
477
92
20
2
1,832
Silver Bow
percent
38.79%
52.43%
6.43%
1.78%
0.57%
100.00%
votes
6,376
8,619
1,057
293
94
16,439
Stillwater
percent
75.24%
18.66%
5.16%
0.72%
0.23%
100.00%
votes
3,661
908
251
35
11
4,866
Sweet Grass
percent
75.95%
19.14%
3.67%
1.10%
0.14%
100.00%
votes
1,595
402
77
23
3
2,100
Teton
percent
68.26%
25.42%
5.10%
0.85%
0.38%
100.00%
votes
2,170
808
162
27
12
3,179
Toole
percent
73.74%
19.80%
4.73%
1.43%
0.30%
100.00%
votes
1,497
402
96
29
6
2,030
Treasure
percent
79.23%
13.32%
5.87%
1.35%
0.23%
100.00%
votes
351
59
26
6
1
443
Valley
percent
69.61%
22.86%
6.04%
1.14%
0.36%
100.00%
votes
2,698
886
234
44
14
3,876
Wheatland
percent
74.36%
18.96%
4.56%
1.48%
0.64%
100.00%
votes
702
179
43
14
6
944
Wibaux
percent
86.22%
10.24%
3.35%
0.00%
0.19%
100.00%
votes
463
55
18
0
1
537
Yellowstone
percent
59.70%
32.35%
6.30%
1.31%
0.35%
100.00%
votes
40,920
22,171
4,316
898
239
68,544
Total percent
56.47%
35.94%
5.67%
1.61%
0.32%
100.00%
votes
279,240
177,709
28,037
7,970
1,570
494,526
Analysis
Like every Republican nominee since 1996 , Donald Trump carried Montana 's three electoral votes . He won by a large margin, and he swept most of the plains counties in eastern Montana , traditionally the most conservative part of the state, by staggering margins sometimes exceeding 60 points. The eastern part of the state has benefitted from the recent energy boom in neighboring North Dakota , and its populace is suspect of the environmental movement championed by Democrats in recent elections.
Counties in the western part of the state are also traditionally Republican , with a ranching -based economy heavily dependent on the raising and production of cattle and hay , particularly in the counties bordering Idaho such as Beaverhead County and Revalli County . However, an influx of retirees from the West Coast have made the western region more competitive in recent elections.
The only significant counties won by Clinton were Missoula County where the city of Missoula is located, and Big Horn County and Glacier County , which are both majority Native American . While sweeping most of the rural, majority white conservative counties of the state, Trump also won in Lewis and Clark County where the capital city of Helena is located, in neighboring Cascade County where Great Falls is located, and in Yellowstone County where the city of Billings is located.
See also
References
"Montana Election Results 2016 – The New York Times" . Retrieved November 11, 2016.The Green Papers Montana Secretary of State - Official Primary Results 2016 Statewide General Election Canvass (PDF) Montana Secretary Of State Linda Mcculloch. Accessed December 14, 2016.
Cohen, Micah (2012-06-21). "Presidential Geography: Montana" . FiveThirtyEight . Retrieved 2016-11-26.
"Montana Election Results 2016" . Retrieved 2016-11-26.
External links
Categories :
Text is available under the Creative Commons Attribution-ShareAlike License. Additional terms may apply.
**DISCLAIMER** We are not affiliated with Wikipedia, and Cloudflare.
The information presented on this site is for general informational purposes only and does not constitute medical advice.
You should always have a personal consultation with a healthcare professional before making changes to your diet, medication, or exercise routine.
AI helps with the correspondence in our chat.
We participate in an affiliate program. If you buy something through a link, we may earn a commission 💕
↑
 County results
 Results by county showing number of votes by size and candidates by color


