(Redirected from 1998 Illinois Comptroller election )
1998 Illinois elections Turnout 52.43%
Elections were held in Illinois Primary elections were held on March 17, 1998.
These elections saw Democrats make gains. The Democratic Party went from holding no statewide offices, to holding two.
Election information
1998 was a midterm election year in the United States.
Turnout
Primary election
For the primary election, turnout was 27.04%, with 1,824,806 votes cast.
Turnout by county
County
Registration
Votes cast
Turnout
Adams 39,753
8,380
21.08%
Alexander
7,519
3,603
47.92%
Bond
9,811
1,793
18.28%
Boone
22,061
7,131
32.32%
Brown
3,271
2,029
62.03%
Bureau
25,112
7,924
31.55%
Calhoun
3,798
1,220
32.12%
Carroll
10,905
3,842
35.23%
Cass
9,649
4,374
45.33%
Champaign
115,156
21,566
18.73%
Christian
23,603
8,173
34.63%
Clark
12,084
3,727
30.84%
Clay
10,087
2,676
26.53%
Clinton
24,358
2,950
12.11%
Coles
29,461
9,289
31.53%
Cook
2,721,334
780,580
28.68%
Crawford
13,381
3,772
28.19%
Cumberland
7,915
2,686
33.94%
DeKalb
45,534
8,651
19%
DeWitt
11,513
2,244
19.49%
Douglas
11,281
2,319
20.56%
DuPage
460,688
113,345
24.6%
Edgar
13,029
3,149
24.17%
Edwards
5,143
2,380
46.28%
Effingham
19,711
6,133
31.11%
Fayette
13,422
3,850
28.68%
Ford
8,384
4,543
54.19%
Franklin
30,636
13,688
44.68%
Fulton
25,999
9,500
36.54%
Gallatin
4,731
2,812
59.44%
Greene
8,923
2,801
31.39%
Grundy
22,468
5,960
26.53%
Hamilton
6,379
3,415
53.54%
Hancock
12,821
4,967
38.74%
Hardin
3,743
2,417
64.57%
Henderson
5,324
2,154
40.46%
Henry
32,819
7,881
24.01%
Iroquois
18,397
5,591
30.39%
Jackson
44,300
10,881
24.56%
Jasper
7,547
3,862
51.17%
Jefferson
25,924
7,253
27.98%
Jersey
13,964
4,029
28.85%
Jo Daviess
14,413
2,827
19.61%
Johnson
7,120
3,676
51.63%
Kane
177,041
51,342
29.00%
Kankakee
57,482
8,217
14.29%
Kendall
31,224
7,430
23.8%
Knox
34,117
7,757
22.74%
Lake
316,111
78,977
24.98%
LaSalle
65,229
16,659
25.54%
Lawrence
11,336
2,834
25.00%
Lee
20,431
6,332
30.99%
Livingston
22,714
8,902
39.19%
Logan
18,665
7,589
40.66%
Macon
72,319
20,844
28.82%
Macoupin
35,243
10,428
29.59%
Madison
164,136
34,057
20.75%
Marion
28,158
7,408
26.31%
Marshall
8,386
1,684
20.08%
Mason
10,598
2,214
20.89%
Massac
12,435
3,454
27.78%
McDonough
18,536
4,658
25.13%
McHenry
142,461
39,492
27.72%
McLean
85,655
18,930
22.1%
Menard
8,194
3,018
36.83%
Mercer
11,717
2,274
19.41%
Monroe
18,228
6,089
33.4%
Montgomery
20,983
4,232
20.17%
Morgan
20,885
4,331
20.74%
Moultrie
8,234
2,916
35.41%
Ogle
28,094
6,932
24.67%
Peoria
105,139
20,889
19.87%
Perry
15,388
5,828
37.87%
Piatt
11,034
2,960
26.83%
Pike
12,814
4,611
35.98%
Pope
3,250
1,820
56.00%
Pulaski
5,470
2,445
44.70%
Putnam
4,383
2,131
48.62%
Randolph
23,496
8,155
34.71%
Richland
12,753
4,028
31.58%
Rock Island
101,715
22,710
22.33%
Saline
18,053
9,025
49.99%
Sangamon
121,984
35,680
29.25%
Schuyler
5,926
2,107
35.56%
Scott
3,627
1,493
41.16%
Shelby
14,326
4,857
33.9%
Stark
4,540
1,135
25.00%
St. Clair
153,502
29,738
19.37%
Stephenson
31,107
7,920
25.46%
Tazewell
81,769
23,112
28.26%
Union
14,571
6,063
41.61%
Vermilion
50,035
11,115
22.21%
Wabash
9,191
2,125
23.12%
Warren
11,279
2,944
26.1%
Washington
10,663
2,860
26.82%
Wayne
12,773
4,263
33.38%
White
11,693
5,442
46.54%
Whiteside
35,370
4,726
13.36%
Will
229,337
53,784
23.45%
Williamson
39,063
16,509
42.26%
Winnebago
158,118
29,238
18.49%
Woodford
22,924
10,050
43.84%
Total
6,747,376
1,824,806
27.04%
General election
For the general election, turnout was 52.43%, with 3,541,379 votes cast.
Turnout by county
County
Registration
Votes cast
Turnout%
Adams 41,285
25,575
61.95%
Alexander
7,547
3,990
52.87%
Bond
10,205
5,343
52.36%
Boone
21,953
9,950
45.32%
Brown
3,565
2,850
79.94%
Bureau
24,773
15,087
60.9%
Calhoun
3,745
2,650
70.76%
Carroll
10,385
6,199
59.69%
Cass
9,752
4,723
48.43%
Champaign
127,069
50,026
39.37%
Christian
24,112
12,302
51.02%
Clark
12,197
6,517
53.43%
Clay
9,254
5,354
57.86%
Clinton
24,391
11,990
49.16%
Coles
30,165
16,959
56.22%
Cook
2,625,022
1,433,423
54.61%
Crawford
13,763
7,194
52.27%
Cumberland
8,125
4,186
51.52%
DeKalb
52,659
22,131
42.03%
DeWitt
10,408
5,294
50.86%
Douglas
11,637
5,911
50.79%
DuPage
443,387
257,729
58.13%
Edgar
13,280
7,447
56.08%
Edwards
5,127
2,971
57.95%
Effingham
20,666
11,639
56.32%
Fayette
14,035
8,189
58.35%
Ford
8,660
5,478
63.26%
Franklin
31,202
17,097
54.79%
Fulton
24,611
13,026
52.93%
Gallatin
4,704
3,215
68.35%
Greene
8,769
5,047
57.56%
Grundy
23,476
12,533
53.39%
Hamilton
6,487
4,368
67.33%
Hancock
13,271
8,234
62.05%
Hardin
3,833
2,824
73.68%
Henderson
5,493
3,578
65.14%
Henry
33,838
19,022
56.21%
Iroquois
18,137
11,150
61.48%
Jackson
43,168
18,919
43.83%
Jasper
7,673
4,274
55.7%
Jefferson
26,587
12,683
47.7%
Jersey
13,126
7,364
56.1%
Jo Daviess
15,017
8,109
54%
Johnson
7,487
5,038
67.29%
Kane
188,596
91,059
48.28%
Kankakee
55,176
30,720
55.68%
Kendall
32,945
15,596
47.34%
Knox
34,377
19,379
56.37%
Lake
309,409
158,547
51.24%
LaSalle
67,876
35,919
52.92%
Lawrence
9,875
5,604
56.75%
Lee
21,205
11,086
52.28%
Livingston
21,433
12,212
56.98%
Logan
19,243
10,772
55.98%
Macon
74,913
40,772
54.43%
Macoupin
35,725
15,754
44.1%
Madison
170,151
74,485
43.78%
Marion
29,529
12,430
42.09%
Marshall
8,564
4,467
52.16%
Mason
10,192
5,331
52.31%
Massac
12,760
5,669
44.43%
McDonough
19,632
10,631
54.15%
McHenry
150,683
66,836
44.36%
McLean
94,605
39,813
42.08%
Menard
8,405
5,164
61.44%
Mercer
12,025
7,093
58.99%
Monroe
18,405
9,945
54.03%
Montgomery
21,153
10,255
48.48%
Morgan
21,680
12,032
55.5%
Moultrie
8,208
4,670
56.9%
Ogle
29,479
14,042
47.63%
Peoria
110,820
54,623
49.29%
Perry
15,156
9,652
63.68%
Piatt
11,197
6,351
56.72%
Pike
11,903
7,532
63.28%
Pope
3,332
2,284
68.55%
Pulaski
6,360
3,090
48.58%
Putnam
4,167
2,529
60.69%
Randolph
23,870
13,185
55.24%
Richland
13,226
6,739
50.95%
Rock Island
103,597
48,714
47.02%
Saline
18,579
11,664
62.78%
Sangamon
118,453
76,639
64.7%
Schuyler
6,024
3,398
56.41%
Scott
3,685
2,338
63.45%
Shelby
14,849
8,795
59.23%
Stark
4,586
2,557
55.76%
St. Clair
160,520
72,357
45.08%
Stephenson
32,197
13,674
42.47%
Tazewell
84,100
40,613
48.29%
Union
12,425
7,712
62.07%
Vermilion
49,454
24,994
50.54%
Wabash
9,378
4,978
53.08%
Warren
11,637
6,261
53.8%
Washington
9,985
6,320
63.29%
Wayne
12,776
7,097
55.55%
White
11,646
7,662
65.79%
Whiteside
36,726
17,745
48.32%
Will
271,410
124,154
45.74%
Williamson
40,339
24,470
60.66%
Winnebago
158,736
72,992
45.98%
Woodford
23,575
12,389
52.55%
Total
6,754,998
3,541,379
52.43%
Federal elections
United States Senate
Main article: 1998 United States Senate election in Illinois
See also: 1998 United States Senate elections
Incumbent Democratic United States Senator Carol Moseley Braun lost reelection, being unseated by Republican Peter Fitzgerald .
United States House
Main article: 1998 United States House of Representatives elections in Illinois
See also: 1998 United States House of Representatives elections
All 20 of Illinois' seats in the United States House of Representatives were up for election in 1998.
No seats switched parties, leaving the composition of Illinois' House delegation 10 Democrats and 10 Republicans.
State elections
Governor and Lieutenant Governor
Main article: 1998 Illinois gubernatorial election
1998 Illinois gubernatorial election Turnout 49.72%
Ryan: 40–50% 50–60% 60–70% 70–80%Poshard: 50–60% 60–70% 70–80% 80–90%
Incumbent Governor Jim Edgar , a Republican, did not seek a third term. Republican George Ryan was elected to succeed him.
Attorney General
1998 Illinois Attorney General election Turnout 49.25%
Ryan: 50–60% 60–70% 70–80% 80–90%Santos: 50–60%
Incumbent Attorney General Jim Ryan , a Republican, was reelected to a second term. As of 2022 this is the last time a Republican was elected Illinois Attorney General.
Democratic primary
Republican primary
Attorney General Republican primary
Party
Candidate
Votes
%
Republican Jim Ryan (incumbent) 643,487
100
Total votes
643,487
100
Reform primary
Attorney General Reform primary
Party
Candidate
Votes
%
Reform Jesse M. Dowell, Jr.
332
50.53
Reform
Daniel J. Kairis
325
49.47
Total votes
657
100
General election
Secretary of State
1998 Illinois Secretary of State election Turnout 50.04%
White: 40–50% 50–60% 60–70% 70–80%Salvi: 40–50% 50–60% 60–70%
Incumbent Secretary of State George Ryan , a Republican, did not seek reelection to a third term in office, instead opting to run for governor. Democrat Jesse White was elected to succeed him in office.
Democratic primary
Republican primary
Reform primary
Secretary of State Reform primary
Party
Candidate
Votes
%
Reform Sandra Millatti
426
66.46
Reform
Maryam Omar
215
33.54
Total votes
641
100
General election
Comptroller
1998 Illinois State Comptroller election Turnout 47.85%
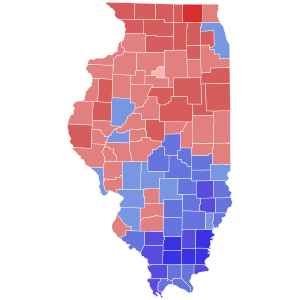
Hynes: 40–50% 50–60% 60–70% 70–80%Lauzen: 40–50% 50–60% 60–70%
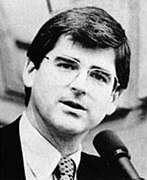
Incumbent Comptroller Loleta Didrickson , a Republican, did not seek reelection to a second term, instead opting to (ultimately unsuccessfully) run for the Republican nomination for United States Senate. Democrat Daniel Hynes was elected to succeed her in office.
Democratic primary
Comptroller Democratic primary
Party
Candidate
Votes
%
Democratic Daniel Hynes 632,141
100
Total votes
632,141
100
Republican primary
Reform primary
Comptroller Reform primary
Party
Candidate
Votes
%
Reform Houstoun McIntosh Sadler II
579
100
Total votes
579
100
General election
Treasurer
1998 Illinois State Treasurer election Turnout 47.71%
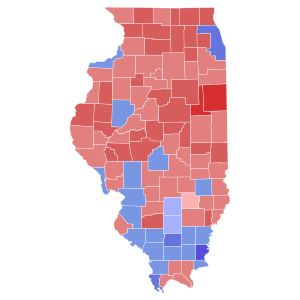
Topinka: 40–50% 50–60% 60–70% 70–80%McLaughlin: 40–50% 50–60% 60–70% 70–80%
Incumbent Treasurer Judy Baar Topinka , a Republican, was reelected to a second term.
Democratic primary
Orland Park mayor Daniel J. McLaughlin defeated Calumet City mayor Jerry Genova.
Treasurer Democratic primary
Party
Candidate
Votes
%
Democratic Daniel J. McLaughlin
419,735
57.51
Democratic
Jerry Genova
310,052
42.49
Total votes
729,787
100
Republican primary
Reform primary
Treasurer Reform primary
Party
Candidate
Votes
%
Reform Valorie Bain
338
50.90
Reform
William P. Rakes
326
49.10
Total votes
664
100
General election
State Senate
1998 Illinois Senate election
← 1996
November 3, 1998 (1998-11-03) 2000 →
Illinois Senate
Majority party
Minority party
Party
Republican
Democratic
Last election
31
28
Seats won
32
27
Seat change
Results:
41 out of 59 seats in the Illinois Senate were up for election in 1998. Republicans retained control of the chamber.
State House of Representatives
1998 Illinois House of Representatives election
← 1996
November 3, 1998 (1998-11-03) 2000 →
Illinois House of Representatives
Results:
All of the seats in the Illinois House of Representatives were up for election in 1998. Democrats retained control of the chamber.
Judicial elections
Multiple judicial positions were up for election in 1998.
Ballot measure
Illinois voters voted on a single ballot measure in 1998. In order to be approved, the measures required either 60% support among those specifically voting on the amendment or 50% support among all ballots cast in the elections.
Illinois Courts Commission Amendment
Voters approved the Illinois Courts Commission Amendment, a legislatively referred constitutional amendment which amended Article VI, Section 15 of the Constitution of Illinois to make modifications to the courts commission.
Illinois Courts Commission Amendment
Option
Votes
% of votes
% of all ballots
Yes
1,677,109
80.47
47.37
No
407,014
19.53
11.49
Total votes
2,084,123
100
58.85
Voter turnout
30.85%
Local elections
Local elections were held. These included county elections, such as the Cook County elections .
Notes
Cook County primary election turnout, see 1998 Cook County, Illinois elections#Primary election
Cook County general election turnout, see 1998 Cook County, Illinois elections#General election
References
"Illinois Primary Results - March 17, 1998" . www.cnn.com . CNN. Retrieved March 26, 2020.^ "Voter Turnout" . www.elections.il.gov . Illinois State Board of Elections. Archived from the original on May 30, 2021. Retrieved March 25, 2020.
^ "Election Results" . www.elections.il.gov . Illinois State Board of Elections. Archived from the original on February 22, 2020. Retrieved March 23, 2020.
"ORLAND MOVES TO CONTROL GROWTH" . Crain's Chicago Business . August 6, 1994. Retrieved April 7, 2020.O'Connor, Matt (March 14, 2002). "Ex-Cal City chief gets prison term" . chicagotribune.com . Chicago Tribune. Retrieved March 26, 2020.
^ "1998 GENERAL ELECTION" . www.elections.il.gov . Illinois State Board of Elections. Retrieved January 1, 2025.
^ "Party control of Illinois state government" . Ballotpedia . Retrieved March 26, 2020.
^ "Illinois Constitution - Amendments Proposed" . www.ilga.gov . Illinois General Assembly. Retrieved March 26, 2020.
"Illinois Courts Commission, Amendment 1 (1998)" . Ballotpedia . Retrieved March 29, 2020.
Categories :
Text is available under the Creative Commons Attribution-ShareAlike License. Additional terms may apply.
**DISCLAIMER** We are not affiliated with Wikipedia, and Cloudflare.
The information presented on this site is for general informational purposes only and does not constitute medical advice.
You should always have a personal consultation with a healthcare professional before making changes to your diet, medication, or exercise routine.
AI helps with the correspondence in our chat.
We participate in an affiliate program. If you buy something through a link, we may earn a commission 💕
↑
 County results
  County results
  County results
  County results
  County results
  Results:
 Results:


