| ||||||||||||||||||||||||||||
All 8 Maryland seats to the United States House of Representatives | ||||||||||||||||||||||||||||
|---|---|---|---|---|---|---|---|---|---|---|---|---|---|---|---|---|---|---|---|---|---|---|---|---|---|---|---|---|
| ||||||||||||||||||||||||||||

| ||||||||||||||||||||||||||||
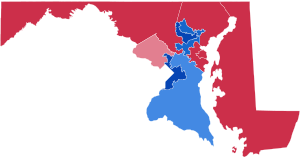
The 2000 congressional elections in Maryland were held on November 7, 2000, to determine the persons representing the state of Maryland in the United States House of Representatives. Maryland held eight seats in the House, apportioned according to the 1990 United States census. Representatives were elected for two-year terms; those elected in 2000 served in the 107th Congress from January 3, 2001, until January 3, 2003.
As of 2021, this is the last time that Maryland's delegation to the United States House of Representatives was tied, or that Republicans have even won more two seats.
Overview
| Party | Seats | Gains | Losses | Net gain/loss | Seats % | Votes % | Votes | +/− | |
|---|---|---|---|---|---|---|---|---|---|
| Democratic | 4 | 0 | 0 | 0 | 50% | 55.06% | 1,060,934 | +0.54% | |
| Republican | 4 | 0 | 0 | 0 | 50% | 44.44% | 856,306 | -1.04% | |
| Constitution | 0 | 0 | 0 | 0 | — | 0.36% | 7,017 | +0.36% | |
| Libertarian | 0 | 0 | 0 | 0 | — | 0.01% | 238 | +0.01% | |
| Green | 0 | 0 | 0 | 0 | — | 0.01% | 155 | +0.01% | |
| Other parties | 0 | 0 | 0 | 0 | — | 0.11% | 2,114 | +0.11% | |
| Totals | 8 | 0 | 0 | — | 100% | 100% | 1,926,764 | ||
District 1
See also: Maryland's 1st congressional district| Party | Candidate | Votes | % | ±% | |
|---|---|---|---|---|---|
| Republican | Wayne Gilchrest (inc.) | 165,293 | 64.40 | ||
| Democratic | Bennett Bozman | 91,022 | 35.46 | ||
| Write-in | 367 | 0.14 | |||
| Total votes | 256,682 | 100.00 | |||
| Republican hold | |||||
District 2
See also: Maryland's 2nd congressional district| Party | Candidate | Votes | % | ±% | |
|---|---|---|---|---|---|
| Republican | Robert Ehrlich (inc.) | 178,556 | 68.56 | ||
| Democratic | Kenneth Bosley | 81,591 | 31.33 | ||
| Write-in | 285 | 0.11 | |||
| Total votes | 260,432 | 100.00 | |||
| Republican hold | |||||
District 3
See also: Maryland's 3rd congressional district| Party | Candidate | Votes | % | ±% | |
|---|---|---|---|---|---|
| Democratic | Benjamin Cardin (inc.) | 169,347 | 75.66 | ||
| Republican | Colin Harby | 53,827 | 24.05 | ||
| Write-in | 644 | 0.29 | |||
| Total votes | 223,818 | 100.00 | |||
| Democratic hold | |||||
District 4
See also: Maryland's 4th congressional district| Party | Candidate | Votes | % | ±% | |
|---|---|---|---|---|---|
| Democratic | Albert Wynn (inc.) | 172,624 | 87.20 | ||
| Republican | John Kimble | 24,973 | 12.61 | ||
| Write-in | 372 | 0.19 | |||
| Total votes | 197,969 | 100.00 | |||
| Democratic hold | |||||
District 5
See also: Maryland's 5th congressional district| Party | Candidate | Votes | % | ±% | |
|---|---|---|---|---|---|
| Democratic | Steny Hoyer (inc.) | 166,231 | 65.09 | ||
| Republican | Thomas E. Hutchins | 89,019 | 34.86 | ||
| Write-in | 125 | 0.05 | |||
| Total votes | 255,375 | 100.00 | |||
| Democratic hold | |||||
District 6
See also: Maryland's 6th congressional district| Party | Candidate | Votes | % | ±% | |
|---|---|---|---|---|---|
| Republican | Roscoe Bartlett (inc.) | 168,624 | 60.65 | ||
| Democratic | Donald DeArmon | 109,136 | 39.25 | ||
| Write-in | 285 | 0.10 | |||
| Total votes | 278,045 | 100.00 | |||
| Republican hold | |||||
District 7
See also: Maryland's 7th congressional district| Party | Candidate | Votes | % | ±% | |
|---|---|---|---|---|---|
| Democratic | Elijah Cummings (inc.) | 134,066 | 87.07 | ||
| Republican | Kenneth Kondner | 19,773 | 12.84 | ||
| Write-in | 135 | 0.09 | |||
| Total votes | 153,974 | 100.00 | |||
| Democratic hold | |||||
District 8
See also: Maryland's 8th congressional district| Party | Candidate | Votes | % | ±% | |
|---|---|---|---|---|---|
| Republican | Constance Morella (inc.) | 156,241 | 52.00 | ||
| Democratic | Terry Lierman | 136,840 | 45.54 | ||
| Constitution | Brian Saunders | 7,017 | 2.34 | New | |
| Write-in | 371 | 0.12 | |||
| Total votes | 300,469 | 100.00 | |||
| Republican hold | |||||
References
- "Office of the Clerk, U.S. House of Representatives".
- ^ "Federal Elections 2000" (PDF). Federal Election Commission. June 2001.
External links
| General | |
|---|---|
| Governor |
|
| State Senate | |
| House of Delegates | |
| U.S. President | |
| U.S. Senate |
|
| U.S. House |
|
| Attorney General | |
| Comptroller | |
| County Executive | |
| County offices | |
| See also: Political party strength in Maryland | |
| (1999 ←) 2000 United States elections (→ 2001) | |
|---|---|
| President | |
| U.S. Senate |
|
| U.S. House |
|
| State governors | |
| Attorneys General | |
| State legislature |
|
| Mayors | |
