Main article: 1972 United States presidential election
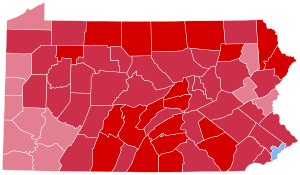
1972 United States presidential election in Pennsylvania
Nixon
50-60% 60-70% 70-80% 80–90% 90–100%
McGovern
50-60% 60-70% 70–80%
Tie/No Data
The 1972 United States presidential election in Pennsylvania took place on November 7, 1972, and was part of the 1972 United States presidential election . Voters chose 27 representatives, or electors to the Electoral College , who voted for president and vice president .
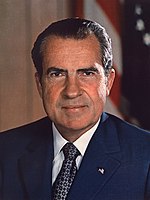
Pennsylvania strongly voted for the Republican nominee, President Richard Nixon , over the Democratic nominee, Senator George McGovern . Nixon won Pennsylvania by a large margin of 19.98%, winning every county except for Philadelphia . This result nonetheless was over 3% more Democratic than the nation at-large. As of the 2024 presidential election , this is the last election in which Allegheny County voted Republican, as well as the last time when the Republican presidential nominee carried the state by double digits.
Results
1972 United States presidential election in Pennsylvania
Party
Candidate
Votes
Percentage
Electoral votes
Republican Richard Nixon (incumbent)2,714,521
59.11%
27
Democratic
George McGovern
1,796,951
39.13%
0
Constitution
John G. Schmitz
70,593
1.54%
0
Socialist Workers
Linda Jenness
4,639
0.10%
0
Write-ins
Write-ins
2,715
0.06%
0
Communist
Gus Hall
2,686
0.06%
0
Totals
4,592,106
100.0%
27
Voter Turnout (Voting age/Registered)
56%/78%
Results by county
County
Richard Nixon
George McGovern
John G. Schmitz
Various candidates
Margin
Total votes cast
#
%
#
%
#
%
#
%
#
%
Adams
13,593
70.19%
5,529
28.55%
227
1.17%
16
0.08%
8,064
41.64%
19,365
Allegheny
371,737
55.60%
282,496
42.26%
12,491
1.87%
1,811
0.27%
89,241
13.34%
668,535
Armstrong
17,557
61.61%
10,490
36.81%
412
1.45%
39
0.14%
7,067
24.80%
28,498
Beaver
43,637
56.42%
31,570
40.82%
1,718
2.22%
412
0.53%
12,067
15.60%
77,337
Bedford
11,243
73.30%
3,836
25.01%
227
1.48%
32
0.21%
7,407
48.29%
15,338
Berks
66,172
62.35%
36,563
34.45%
3,130
2.95%
262
0.25%
29,609
27.90%
106,127
Blair
33,126
75.10%
10,023
22.72%
913
2.07%
48
0.11%
23,103
52.38%
44,110
Bradford
15,050
73.57%
5,204
25.44%
179
0.87%
25
0.12%
9,846
48.13%
20,458
Bucks
99,684
62.28%
56,784
35.48%
3,245
2.03%
346
0.22%
42,900
26.80%
160,059
Butler
29,665
65.09%
14,695
32.24%
1,075
2.36%
139
0.30%
14,970
32.85%
45,574
Cambria
43,825
60.05%
27,950
38.30%
894
1.23%
306
0.42%
15,875
21.75%
72,975
Cameron
1,935
68.45%
828
29.29%
48
1.70%
16
0.57%
1,107
39.16%
2,827
Carbon
11,639
59.05%
7,774
39.44%
274
1.39%
25
0.13%
3,865
19.61%
19,712
Centre
20,683
60.48%
13,194
38.58%
273
0.80%
47
0.14%
7,489
21.90%
34,197
Chester
72,726
68.44%
31,118
29.29%
2,281
2.15%
134
0.13%
41,608
39.15%
106,259
Clarion
10,073
67.96%
4,509
30.42%
193
1.30%
46
0.31%
5,564
37.54%
14,821
Clearfield
16,780
63.54%
9,246
35.01%
299
1.13%
84
0.32%
7,534
28.53%
26,409
Clinton
8,205
62.54%
4,772
36.37%
107
0.82%
35
0.27%
3,433
26.17%
13,119
Columbia
14,187
63.59%
7,222
32.37%
857
3.84%
43
0.19%
6,965
31.22%
22,309
Crawford
18,393
64.38%
9,371
32.80%
760
2.66%
45
0.16%
9,022
31.58%
28,569
Cumberland
42,099
72.87%
14,562
25.20%
1,010
1.75%
104
0.18%
27,537
47.67%
57,775
Dauphin
54,307
69.38%
22,587
28.86%
1,270
1.62%
106
0.14%
31,720
40.52%
78,270
Delaware
175,414
63.91%
94,144
34.30%
4,502
1.64%
391
0.14%
81,270
29.61%
274,451
Elk
7,900
61.20%
4,710
36.49%
245
1.90%
53
0.41%
3,190
24.71%
12,908
Erie
61,542
58.22%
42,022
39.75%
1,986
1.88%
163
0.15%
19,520
18.47%
105,713
Fayette
27,288
54.06%
22,475
44.52%
649
1.29%
67
0.13%
4,813
9.54%
50,479
Forest
1,374
71.75%
509
26.58%
21
1.10%
11
0.57%
865
45.17%
1,915
Franklin
24,093
70.01%
9,456
27.48%
808
2.35%
58
0.17%
14,637
42.53%
34,415
Fulton
2,515
66.24%
1,192
31.39%
86
2.26%
4
0.11%
1,323
34.85%
3,797
Greene
7,790
57.52%
5,562
41.07%
151
1.11%
40
0.30%
2,228
16.45%
13,543
Huntingdon
9,606
72.68%
3,394
25.68%
203
1.54%
13
0.10%
6,212
47.00%
13,216
Indiana
18,122
61.90%
10,833
37.01%
290
0.99%
29
0.10%
7,289
24.89%
29,274
Jefferson
11,631
68.92%
5,024
29.77%
204
1.21%
17
0.10%
6,607
39.15%
16,876
Juniata
4,412
66.32%
2,156
32.41%
61
0.92%
24
0.36%
2,256
33.91%
6,653
Lackawanna
58,838
56.11%
45,465
43.35%
495
0.47%
71
0.07%
13,373
12.76%
104,869
Lancaster
81,036
75.64%
24,223
22.61%
1,760
1.64%
119
0.11%
56,813
53.03%
107,138
Lawrence
23,712
56.06%
17,595
41.60%
832
1.97%
158
0.37%
6,117
14.46%
42,297
Lebanon
25,008
77.38%
6,683
20.68%
573
1.77%
56
0.17%
18,325
56.70%
32,320
Lehigh
58,023
62.39%
33,325
35.83%
1,518
1.63%
136
0.15%
24,698
26.56%
93,002
Luzerne
81,358
60.89%
51,128
38.27%
973
0.73%
147
0.11%
30,230
22.62%
133,606
Lycoming
28,913
68.70%
11,999
28.51%
1,058
2.51%
117
0.28%
16,914
40.19%
42,087
McKean
11,958
71.72%
4,513
27.07%
176
1.06%
26
0.16%
7,445
44.65%
16,673
Mercer
27,961
59.37%
18,087
38.40%
985
2.09%
67
0.14%
9,874
20.97%
47,100
Mifflin
9,989
72.10%
3,667
26.47%
169
1.22%
30
0.22%
6,322
45.63%
13,855
Monroe
12,701
67.51%
5,619
29.87%
450
2.39%
44
0.23%
7,082
37.64%
18,814
Montgomery
173,662
64.31%
91,959
34.06%
3,960
1.47%
437
0.16%
81,703
30.25%
270,018
Montour
4,386
69.64%
1,755
27.87%
152
2.41%
5
0.08%
2,631
41.77%
6,298
Northampton
41,822
56.30%
32,335
43.53%
93
0.13%
31
0.04%
9,487
12.77%
74,281
Northumberland
25,912
64.16%
13,885
34.38%
541
1.34%
47
0.12%
12,027
29.78%
40,385
Perry
8,082
73.31%
2,731
24.77%
197
1.79%
15
0.14%
5,351
48.54%
11,025
Philadelphia
344,096
43.89%
431,736
55.07%
5,925
0.76%
2,213
0.28%
-87,640
-11.18%
783,970
Pike
4,568
74.79%
1,385
22.68%
143
2.34%
12
0.20%
3,183
52.11%
6,108
Potter
4,422
70.91%
1,710
27.42%
81
1.30%
23
0.37%
2,712
43.49%
6,236
Schuylkill
44,071
61.56%
26,077
36.42%
1,261
1.76%
186
0.26%
17,994
25.14%
71,595
Snyder
7,308
78.20%
1,834
19.63%
190
2.03%
13
0.14%
5,474
58.57%
9,345
Somerset
19,739
68.44%
8,743
30.31%
303
1.05%
56
0.19%
10,996
38.13%
28,841
Sullivan
1,886
67.17%
885
31.52%
32
1.14%
5
0.18%
1,001
35.65%
2,808
Susquehanna
9,476
67.79%
4,154
29.72%
328
2.35%
21
0.15%
5,322
38.07%
13,979
Tioga
10,028
72.05%
3,733
26.82%
142
1.02%
15
0.11%
6,295
45.23%
13,918
Union
6,905
73.57%
2,278
24.27%
158
1.68%
44
0.47%
4,627
49.30%
9,385
Venango
13,991
67.28%
6,302
30.31%
474
2.28%
27
0.13%
7,689
36.97%
20,794
Warren
10,018
66.05%
4,877
32.16%
252
1.66%
20
0.13%
5,141
33.89%
15,167
Washington
42,587
54.00%
34,781
44.10%
1,119
1.42%
375
0.48%
7,806
9.90%
78,862
Wayne
8,948
74.51%
2,733
22.76%
311
2.59%
17
0.14%
6,215
51.75%
12,009
Westmoreland
75,085
54.60%
59,322
43.13%
2,814
2.05%
306
0.22%
15,763
11.47%
137,527
Wyoming
6,423
74.42%
2,112
24.47%
86
1.00%
10
0.12%
4,311
49.95%
8,631
York
63,606
68.19%
27,520
29.50%
1,953
2.09%
201
0.22%
36,086
38.69%
93,280
Totals
2,714,521
59.11%
1,796,951
39.13%
70,593
1.54%
10,040
0.22%
917,570
19.98%
4,592,105
Counties that flipped from Democratic to Republican
See also
Notes
^
References
‘How the Red and Blue Map Evolved Over the Past Century’ ; America Magazine in The National Catholic Review ; June 29, 2016
David Leip. "1972 Presidential General Election Results – Pennsylvania" . Dave Leip’s U.S. Election Atlas. Retrieved March 24, 2018.
^ "PA US President Race, November 02, 1976" . Our Campaigns.
Categories :
Text is available under the Creative Commons Attribution-ShareAlike License. Additional terms may apply.
**DISCLAIMER** We are not affiliated with Wikipedia, and Cloudflare.
The information presented on this site is for general informational purposes only and does not constitute medical advice.
You should always have a personal consultation with a healthcare professional before making changes to your diet, medication, or exercise routine.
AI helps with the correspondence in our chat.
We participate in an affiliate program. If you buy something through a link, we may earn a commission 💕
↑
 County Results
  Municipality Results


