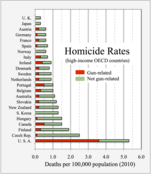
A bar chart or bar graph is a chart or graph that presents categorical data with rectangular bars with heights or lengths proportional to the values that they represent. The bars can be plotted vertically or horizontally. A vertical bar chart is sometimes called a column chart and has been identified as the prototype of charts.
A bar graph shows comparisons among discrete categories. One axis of the chart shows the specific categories being compared, and the other axis represents a measured value. Some bar graphs present bars clustered in groups of more than one, showing the values of more than one measured variable.
History
Many sources consider William Playfair (1759-1824) to have invented the bar chart and the Exports and Imports of Scotland to and from different parts for one Year from Christmas 1780 to Christmas 1781 graph from his The Commercial and Political Atlas to be the first bar chart in history. Diagrams of the velocity of a constantly accelerating object against time published in The Latitude of Forms (attributed to Jacobus de Sancto Martino or, perhaps, to Nicole Oresme) about 300 years before can be interpreted as "proto bar charts".
Usage
 A vertical stacked bar chart with positive values
 A vertical stacked bar chart with negative values
 A horizontal stacked bar chart
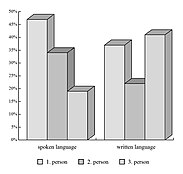
 A vertical, grouped (clustered) 3D bar chart
Bar graphs/charts provide a visual presentation of categorical data. Categorical data is a grouping of data into discrete groups, such as months of the year, age group, shoe sizes, and animals. These categories are usually qualitative. In a column (vertical) bar chart, categories appear along the horizontal axis and the height of the bar corresponds to the value of each category.
Bar charts have a discrete domain of categories, and are usually scaled so that all the data can fit on the chart. When there is no natural ordering of the categories being compared, bars on the chart may be arranged in any order. Bar charts arranged from highest to lowest incidence are called Pareto charts.
Grouped (clustered) and stacked
Bar graphs can also be used for more complex comparisons of data with grouped (or "clustered") bar charts, and stacked bar charts.
In grouped (clustered) bar charts, for each categorical group there are two or more bars color-coded to represent a particular grouping. For example, a business owner with two stores might make a grouped bar chart with different colored bars to represent each store: the horizontal axis would show the months of the year and the vertical axis would show revenue.
Alternatively, Stacked bar charts (also known as Composite bar charts) stack bars on top of each other so that the height of the resulting stack shows the combined result. Unlike a grouped bar chart where each factor is displayed next to another, each with their own bar, the stacked bar chart displays multiple data points stacked in a single row or column. This may, for instance, take the form of uniform height bars charting a time series with internal stacked colours indicating the percentage participation of a sub-type of data. Another example would be a time series displaying total numbers, with internal colors indicating participation in the total by sub-types. Stacked bar charts are not suited to data sets having both positive and negative values.
Grouped bar charts usually present the information in the same order in each grouping. Stacked bar charts present the information in the same sequence on each bar.
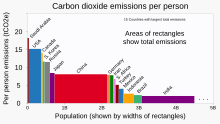
Variable-width (variwide)

* countries' respective populations (along x axis),
* per-person CO2 emissions 1990-2018 (along y axis), and
* total emissions for that country (rectangle area = product
x*y of sides' lengths)Variable-width bar charts, sometimes abbreviated variwide (bar) charts, are bar charts having bars with non-uniform widths. Generally:
- Bars represent quantities with respective rectangles of areas A that are respective arithmetic products of related pairs of
- — vertical-axis quantities (A/X) and
- — horizontal-axis quantities (X). sajith 300
- Anuradhapura 230
- Arithmetically, the area of each bar (rectangle) is determined a product of sides' lengths:
(A/X)*X= Area A for each bar
Roles of the vertical and horizontal axes may be reversed, depending on the desired application.
Examples of variable-width bar charts are shown at Wikimedia Commons.
Advantages
- Easy to read and interpret: Bar charts are easy to read and interpret, even for people without a background in statistics or data visualization. The bars make it easy to compare values and see trends, making it a useful tool for communicating information to a wide range of audiences.
- Can handle large amounts of data: Bar charts can handle large amounts of data and still provide a clear representation of the information. The bars can be made narrow or wide to fit a large number of categories or data points, and the use of color or patterns can make it easier to distinguish between them.
- Customizable: Bar charts can be customized to suit the needs of the user. For example, the color, width, and height of the bars can be adjusted to make the chart more visually appealing, and labels and annotations can be added to provide additional information.
- Useful for comparing values: Bar charts are particularly useful for comparing values between categories or data points. They allow for quick identification of differences and similarities, making it easy to draw conclusions and make decisions.
Limitations
- Limited use for continuous data: Bar charts are not useful for displaying continuous data, such as temperature or time. For continuous data, a line chart or scatter plot may be more appropriate. Bar charts of continuous data with error bars are sometimes referred to as dynamite plots.
- Limited use for small sample sizes: Bar charts may not be useful for displaying small sample sizes, as the bars may not accurately represent the data. In such cases, a histogram or box plot may be more appropriate.
- May be misleading: Bar charts can be misleading if the scale is not appropriate or if the data is presented in a way that is designed to mislead the viewer. For example, if the y-axis is truncated, the differences between the bars may appear larger than they actually are.
- Limited scope for multivariate data: Bar charts can only display one or two variables at a time, making them less useful for displaying multivariate data. In such cases, a scatter plot or heat map may be more appropriate.
See also
- Data and information visualization
- Enhanced Metafile Format to use in office suites, as MS PowerPoint
- Histogram, similar appearance - for continuous data
- Misleading graph
- Progress bar
- To include bar charts in Misplaced Pages, see Extension:EasyTimeline.
References
- Reimann, D.; Struwe, M.; Ram, N.; Gaschler, R. (2022). "Typicality effect in data graphs". Visual Communication. doi:10.1177/14703572221130445.
- Clagett, Marshall (1968), Nicole Oresme and the Medieval Geometry of Qualities and Motions, Madison: Univ. of Wisconsin Press, pp. 85–99, ISBN 0-299-04880-2
- Beniger, James R.; Robyn, Dorothy L. (1978), "Quantitative Graphics in Statistics: A Brief History", The American Statistician, 32 (1), Taylor & Francis, Ltd.: 1–11, doi:10.1080/00031305.1978.10479235, JSTOR 2683467
- Der, Geoff; Everitt, Brian S. (2014). A Handbook of Statistical Graphics Using SAS ODS. Chapman and Hall - CRC. ISBN 978-1-584-88784-3.
- ^ Kelley, W. M.; Donnelly, R. A. (2009) The Humongous Book of Statistics Problems. New York, NY: Alpha Books ISBN 1592578659
- ^ Reid, Nathalie (2018-01-12). "Data Visualization: A Guide to Visual Storytelling for Libraries". Journal of the Medical Library Association. 106 (1): 135. doi:10.5195/jmla.2018.346. ISSN 1558-9439. PMC 5764581.
- ^ Healy, Kieran Joseph (2019). Data visualization : a practical introduction. Princeton, New Jersey. ISBN 978-0-691-18161-5. OCLC 1032356534.
{{cite book}}: CS1 maint: location missing publisher (link) - Riedel, Nico; Schulz, Robert; Kazezian, Vartan; Weissgerber, Tracey (2022-03-15). Replacing bar graphs of continuous data with more informative graphics: Are we making progress? (Report). Scientific Communication and Education. doi:10.1101/2022.03.14.484206.
- Doggett, Thomas J; Way, Connor (2024-01-08). "Dynamite plots in surgical research over 10 years: a meta-study using machine-learning analysis". Postgraduate Medical Journal. doi:10.1093/postmj/qgad134. ISSN 0032-5473.