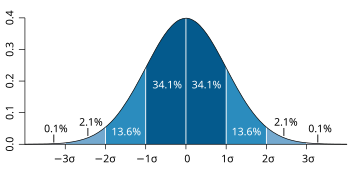
In statistics, the concept of the shape of a probability distribution arises in questions of finding an appropriate distribution to use to model the statistical properties of a population, given a sample from that population. The shape of a distribution may be considered either descriptively, using terms such as "J-shaped", or numerically, using quantitative measures such as skewness and kurtosis.
Considerations of the shape of a distribution arise in statistical data analysis, where simple quantitative descriptive statistics and plotting techniques such as histograms can lead on to the selection of a particular family of distributions for modelling purposes.


Descriptions of shape
The shape of a distribution will fall somewhere in a continuum where a flat distribution might be considered central and where types of departure from this include: mounded (or unimodal), U-shaped, J-shaped, reverse-J shaped and multi-modal. A bimodal distribution would have two high points rather than one. The shape of a distribution is sometimes characterised by the behaviours of the tails (as in a long or short tail). For example, a flat distribution can be said either to have no tails, or to have short tails. A normal distribution is usually regarded as having short tails, while an exponential distribution has exponential tails and a Pareto distribution has long tails.
See also
References
- Yule, G.U., Kendall, M.G. (1950) An Introduction to the Theory of Statistics, 14th Edition (5th Impression, 1968), Griffin, London. Chapter 4 — Frequency Distributions